Enterprise applications need high scalability to cater to a large end user base. The top issues faced by IT Teams in these organizations are monitoring uptime and ensuring good performance for their business applications. To resolve these problems, enterprises need to make strategic investments in end to end application performance management tools that can empower the IT Operations Team to deliver business applications that meet customer expectation.
The movement of business critical applications like CRM, contact management, Order Tracking etc to the cloud is a trend that is picking up very fast especially because of its productivity benefits for a mobile workforce. Large Enterprises too have started consolidating their infrastructure and taken up this delivery model.
Traditionally many ISVs also provide SaaS applications for third party organizations (ASPs). These were applications that were targeted more at the SMB market where adoption because of cost and lesser maintenance issues were the primary driving factors. There is also a trend to move these applications to a cloud (move online) friendly architecture so that it scales for large organizations and they can reduce maintenance and support costs.
Let us take an example of a typical Enterprise Expense Management Application used by ZOHO Inc that is used by a mobile workforce. An expense management application helps the workforce to be compliant with the company policies on travel expenditure and also helps them in reporting appropriately. Additionally for the organization, it is an effective way to keep track of travel expenses or other client servicing costs.
Reporting at regular intervals of time help the finance team to be compliant as per law and also help them understand the impact of various policies on the expense pattern of its employees. However behind this ease of use, stands a complex infrastructure.
John is a Sales Consultant working for ZOHO Inc and travels extensively meeting clients. He uses an Expense Management Application provided by his IT Team. In the last year, during the end of Q4, he had a meeting with an important client in New Jersey. After the meeting, on the way to the airport he tries to access the application and update the billing details. However at 10:10 AM he is stuck with an application that is extremely slow. The reason could be anything from an isolated case of a connectivity problem from his device to a problem at their datacenter where the Expense Management Application is hosted.
He logs the problem immediately with the Help Desk via a phone call. The help desk identifies that this is a problem that users report regularly, however they do not have a solution at hand.
The Application Team says there is no problem with the Application Server hosting the application and various configuration parameters are fine. The Oracle administrators too find everything in place. This is a typical problem for the Operations Teams. There apparently does not seem to be a problem as far as the various application teams are concerned, however end users are not happy.
The WebLogic Administrator however knows that if they restart all the application servers, this problem goes away. They hence restart the application servers and keep their fingers crossed. This is a typical problem for many SaaS applications.
Why are these applications typically Complex ?
An application meant for a large audience would normally be built using either of Java EE or Microsoft .NET technology. These are normally web applications to make access easy and also multi-tiered for ensuring high scalability. Below is an architecture diagram for a typical web application using the SaaS model of delivery:
Web Tier
The web tier is typically present to serve static content and other rich content. It also helps reduce the load on the application tier by moving specialized roles to the best of breed software. Typically Apache, IIS, IBM HTTP etc normally play the role of a web server due to their robust nature.
Application Tier
The application tier consists of the business logic and takes care of the interaction with the data storage mechanisms. It also consists of the Presentation layer in an MVC architecture. The scalability of this tier depends on how many user sessions can be served by the application tier. For the Expense Management Application, the organization uses a Oracle WebLogic 9 Application Server as the middleware component.
Database Tier
This normally consists of an RDBMS like Oracle, SQL Server or databases like MySQL that are quite popular for SaaS deployments. Databases normally are grouped to form a grid architecture that helps ensure high availability and horizontal scalability.
A sample Technology Challenge
The expense management application is built in such a way that there are two database clusters that work together to store the data. Each cluster has one master and one slave database server. There is also one Free Node that takes over as an application server or database server on a need basis. Hence practically if one of these database clusters are down, almost 50% of users will be affected as the data is segmented across two database clusters.
Similarly the application server tier has two types of servers. A group of five application servers do backend jobs like schedule reports, data mining etc. While another set of three application servers serves the web client to the users. Monitoring needs to be done via these Web Client Application servers to ensure page load times are acceptable for end users.
Identify the Problem Patterns
What can be done? Well the obvious resolution is to ensure the Operations team has the right APM tools to first monitor performance. They need to also be equipped with the right Troubleshooting tools to check the server, application server, database server and the network. By monitoring application performance proactively, enterprises can ensure their workforce has better experience and higher productivity that will help them make better decisions.
Application performance management is all about delivering business applications that meet customer satisfaction by deep monitoring, quick troubleshooting and tracking end user experience. In order to do that, the IT Operations team must also be in control of the whole process of application delivery. They should be able to make educated decisions and resolve issues quickly and make optimum use of their time. All these in the end resulting in satisfied customers, efficiently run IT Operations and better ROI.
Top Issues Faced by End Users:
Top Issues Faced by Operations Team in Application Delivery
Top Activities Played by the Operations Team:
These problems can be addressed by having the right process and tools in place.
Traditional Network Monitoring Tools are Not Good Enough. You need to look deeper in to the application to know the real impact of service architectures and real time loads on end user experience.
This consists of tracking performance metrics of applications and servers and ensuring optimal usage of servers. Traditional monitoring tools do simple uptime checks or stop with monitoring CPU Utilization or memory utilization of the Server. However as infrastructure becomes complex, it is essential to monitor the applications on these servers and their performance metrics to better understand where the bottleneck is. With N Tier Application architectures, comes complexity. Hence it is also essential to monitor the uptime and performance of the various tiers like database servers, web servers, mail servers, and other web services.
For example, for checking if a Server is up, we can ping the server. Similarly to check the availability of the database, doing a ping of the server is not enough. We need to run an SQL Query to ensure the database is really running. Additionally, to know the performance of an Oracle database, we need to also monitor metrics like cache hit ratios, tablespace usage etc which are specific to the resource being monitored. This is similar to monitoring the CPU Utilization of the Server. The advantage of monitoring these metrics is better visibility about the usage of these databases, quicker troubleshooting capabilities and optimal usage of your servers.
Monitoring CPU Utilization and memory Utilization are useful to ensure the Technology side of the resources. However it lacks one key capability. By knowing that the Server running your mail server or running your web server has less than 20% CPU Utilization, it does not give you the visibility on actual response time an end user experiences while using your services.
End User Experience Monitoring is an invaluable addition to infrastructure performance monitoring because it helps you deliver better quality of service to the service users.
Some key performance indicators for measuring End User Experience are metrics like:
Monitoring end user experience helps prove to the line of business that you are ensuring the promised SLAs in word and deed.
Once a problem is reported, how much time does it take to identify the root cause of the problem? Hours, weeks or months? Should the problem be notified to the database administrator, application server team or the development team? With a heterogeneous infrastructure, this becomes very tedious.
Application troubleshooting tools help you find out the root cause of a reported problem. For example a Java Transaction Monitoring tool could get in to the details of the Java Transactions executing in an Application Server and help identify which SQL Queries are taking time to execute or which methods in the Java class are slowing down the application. These help save precious time for your application team to resolve a problem.
On the long run, it also helps ensure better performing applications that not only scale but are also reliable making life easy for IT operations.

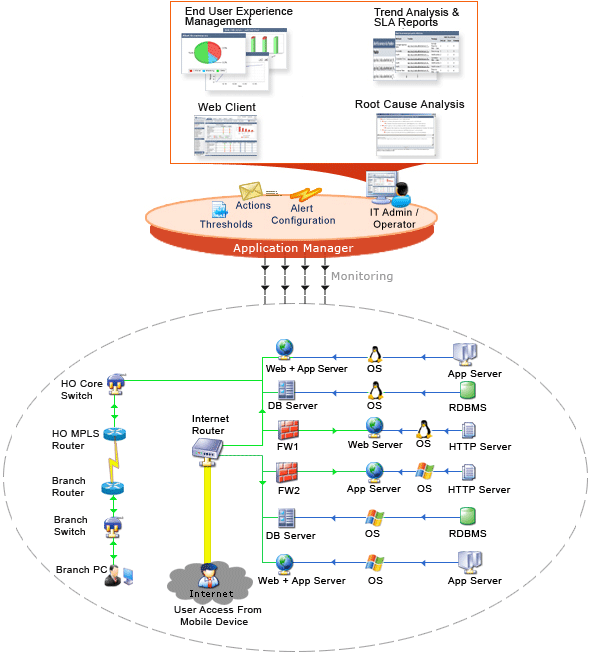
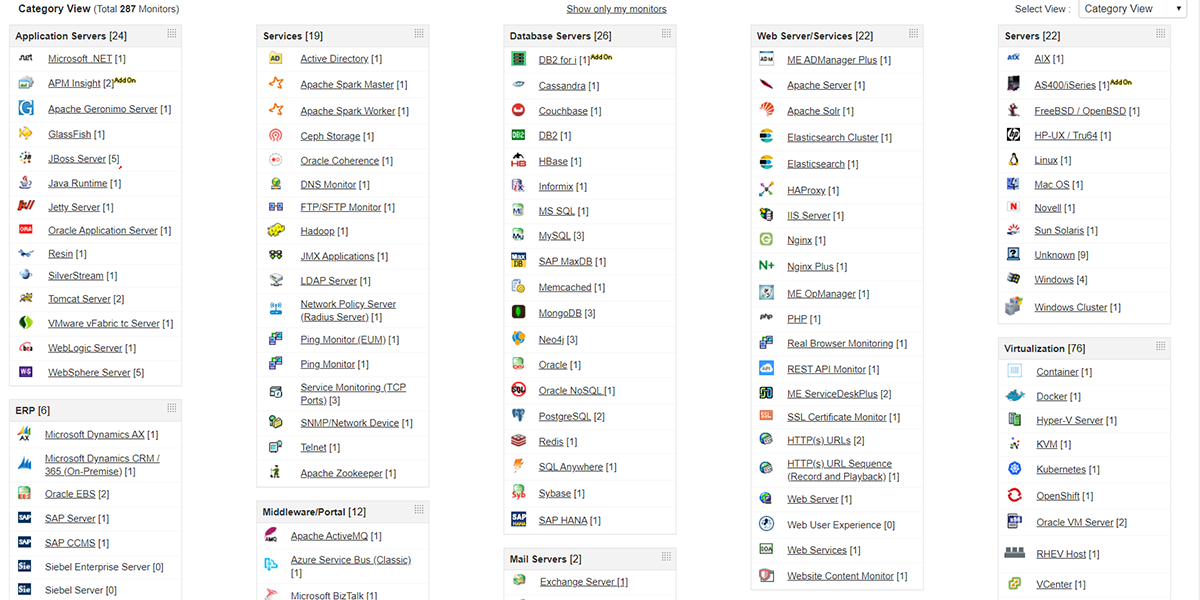
ManageEngine Applications Manager provides in depth monitoring for servers, application servers, databases, ERPs like SAP, web services, network services and an array of other application management capability that will help IT administrators manage their resources.

The deep monitoring helps you plan capacity, troubleshoot quickly and view utilization reports for your various applications. It is easy to setup and uses an agentless approach to monitoring.
The out-of-the-box support for various applications will help your IT Team to track performance issues from a single console, making it cost effective and easy for your technicians to work on a problem.
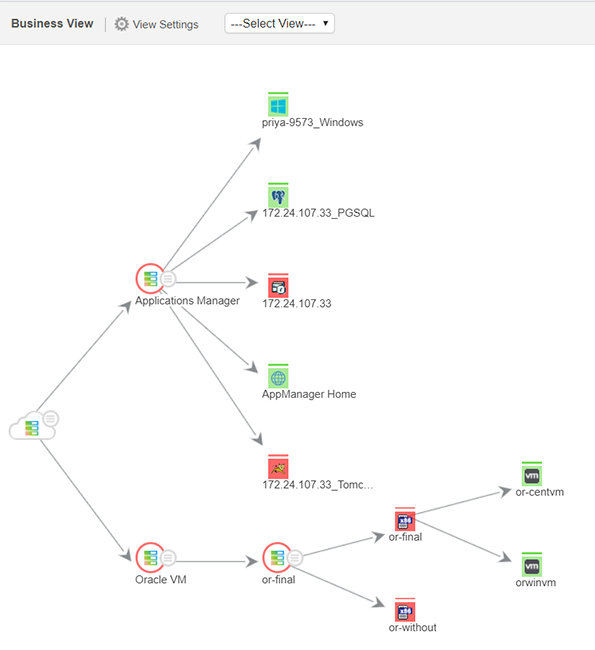
ManageEngine Applications Manager helps group your IT resources and map it to the Business Service it impacts. This will ensure the IT Team knows which events are more critical than the others. This will also help operations to have a better picture of the server farm. For example, knowing which servers belong to the Online Store Application and which one belongs to Payroll, helps in prioritizing production issues. It also helps ensure optimal usage of time and resources.
Too many disparate monitoring tools without any form of integration could create too much noise. False alerts could make the IT Team complacent even when a genuine alert comes. Hence it is essential to ensure there are proper event correlation techniques in place. Investing in an integrated application, server, database and network service monitoring tool helps managing the infrastructure simpler. The application and network services mapping also helps increase the valid events to alarm ratio. Additionally, ManageEngine Applications Manager also supports event correlation for clustered applications and high availability architectures intelligently.
Grouping relevant resources as business services and the Alarm Management capability together can help provide an application topology map in a plasma view. This can help the Operations Team understand the big picture about how the infrastructure functions. This is invaluable especially when there is an emergency.
Instead of the Operations Team going to different servers and using ping, running around for passwords etc, a graphical representation of the network, status of various routes, servers and applications can help the team perform their task quickly.

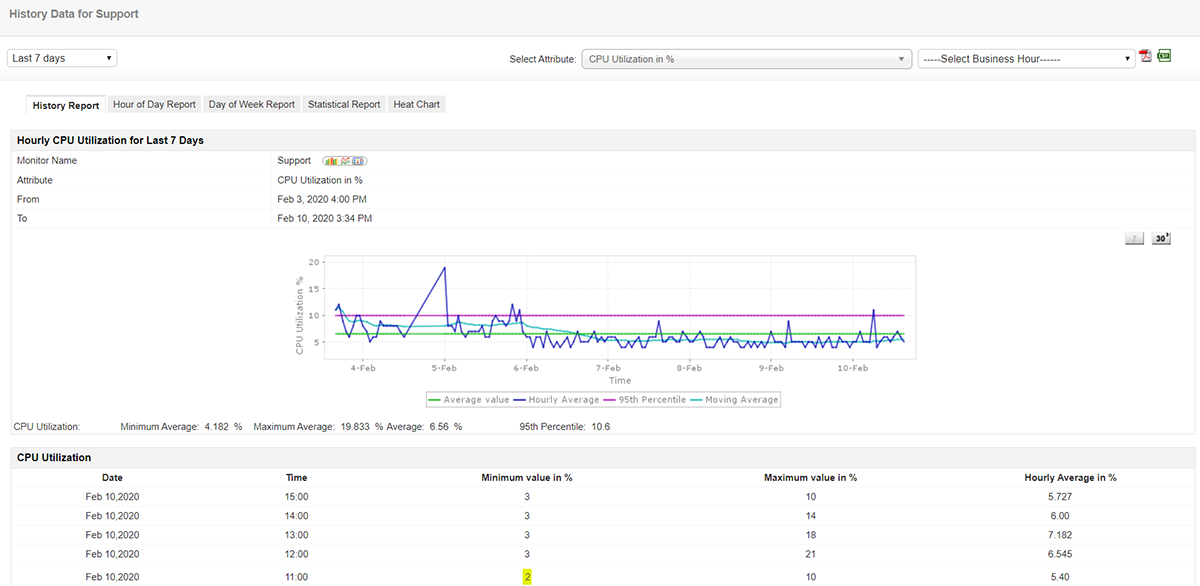
Capacity planning is important to make sure the IT Team provisions servers on time to meet the needs of the business. Different applications and technologies have different metrics that help in capacity planning. For example, if the technology used is Java EE, performance metrics critical for effective functioning are the JVM Memory usage, Free memory etc. These metrics help understand the load on the application and ensure good application scalability.
ManageEngine Applications Manager helps capacity planning by encapsulating the complexity in monitoring these metrics and provides easy to use reports for effective planning.

Enterprises need high scalability architecture to meet their business needs. These architectures make it complex for IT Administrators to manage using traditional NSM tools. Additionally the pressure deliver more with less resources force enterprises to make optimum use of the available hardware without compromising end user experience.
ManageEngine Applications Manager helps the CIO to ensure their investments in mission critical applications are functioning as planned in production. Additionally it helps knowing application downtimes, capacity planning, rapid troubleshooting by encapsulating the complexity in monitoring a heterogeneous IT.