Custom Reports
EventLog Analyzer can generate custom reports based on criteria set by you. You can specify the criteria with field values and logical operators. These reports will be listed under Custom Reports.
Create custom reports
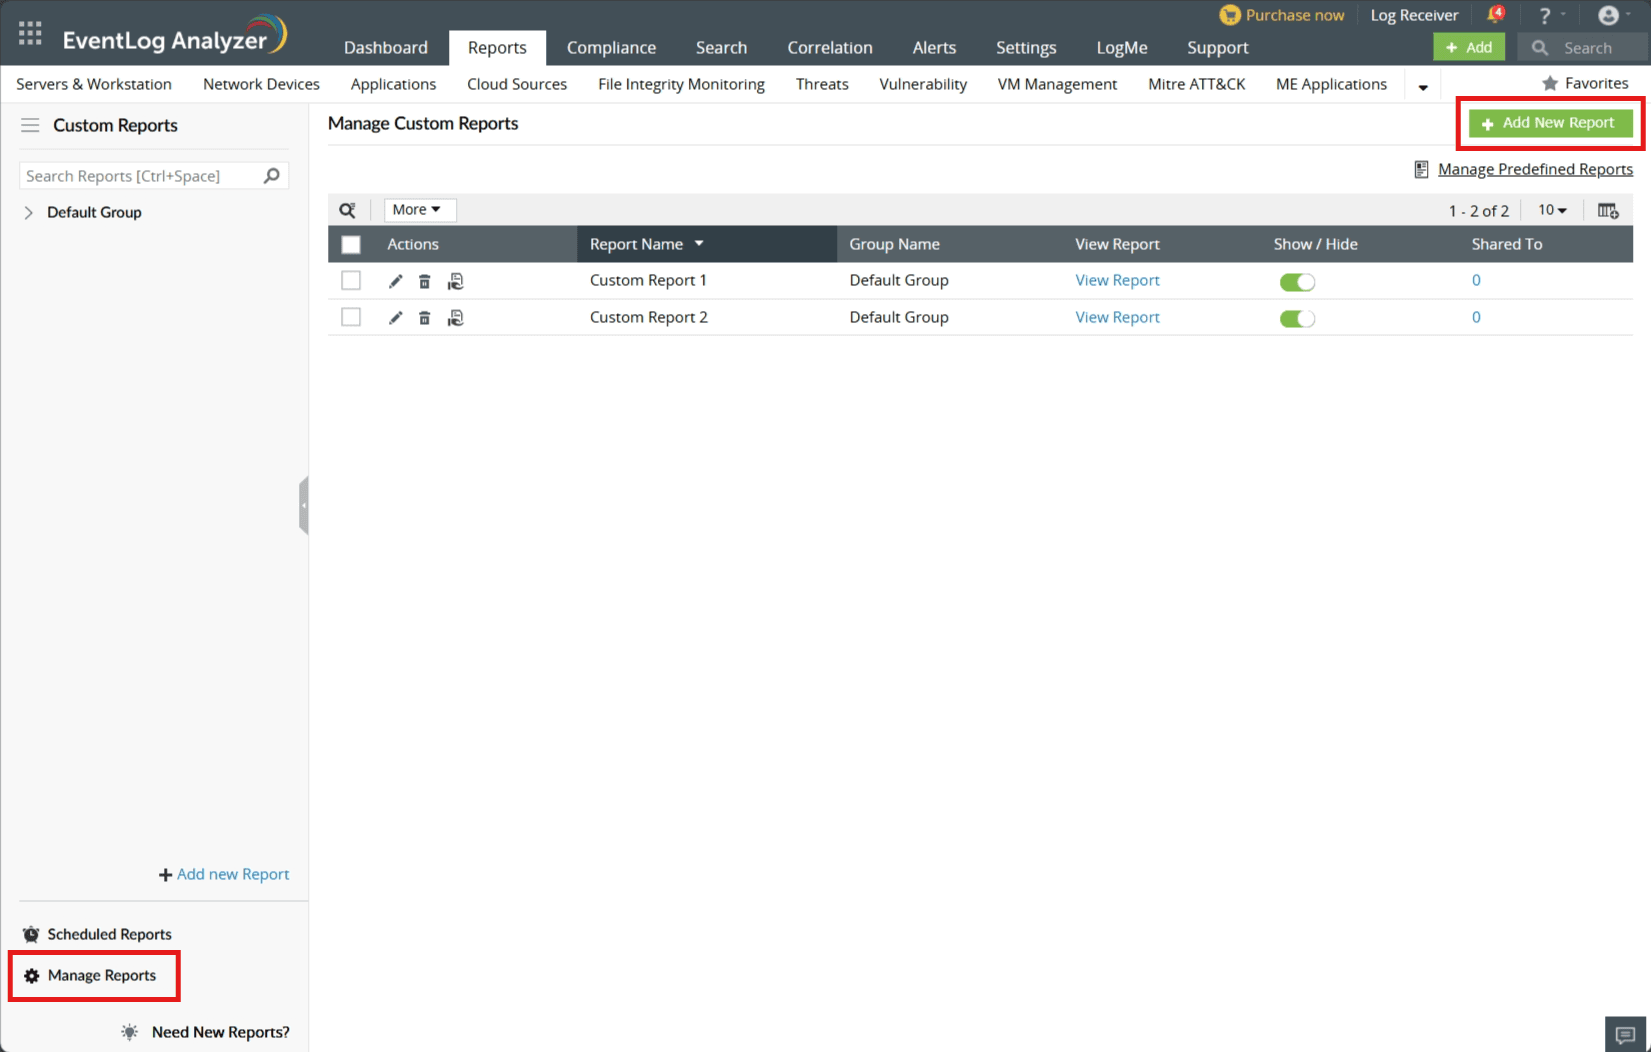
- Navigate to Reports and select Manage Reports at the bottom-left. In the Manage Reports dashboard, click +Add new reports button on the top-right.

- In the Create Custom Report dashboard, enter a name for your report.

- Click Select Device to generate reports for specific devices or applications.

- Click Report Group to add the new report to the desired group. The drop down displays all available report groups under Custom Reports. Select one of these or create your own group and click '+'. If not specified, the custom report will be added to the Default Group.

- Select the type of view for your report (see types of view).

- Set the criteria for the report. You can add multiple criteria and perform AND or OR operations between them. You can also add criteria to groups and perform AND or OR operators between the groups.
Note:
- When the given criteria is separated by commas, it is treated as a separate criteria with OR condition. (Eg: If the criteria is given as EventID = 4678,4679 , then it is treated as EventID= 4678 OR 4679).
- If you intend to give a single criteria with a comma character, please use "," instead of "," .
- Click Add to save.
Manage Custom Reports
You can edit, delete, or disable the custom reports.
- Navigate to Reports. Click Manage Reports at the bottom of the left panel.
- To edit a custom-made report, click on the adjacent edit icon and make the necessary changes. Click Update.

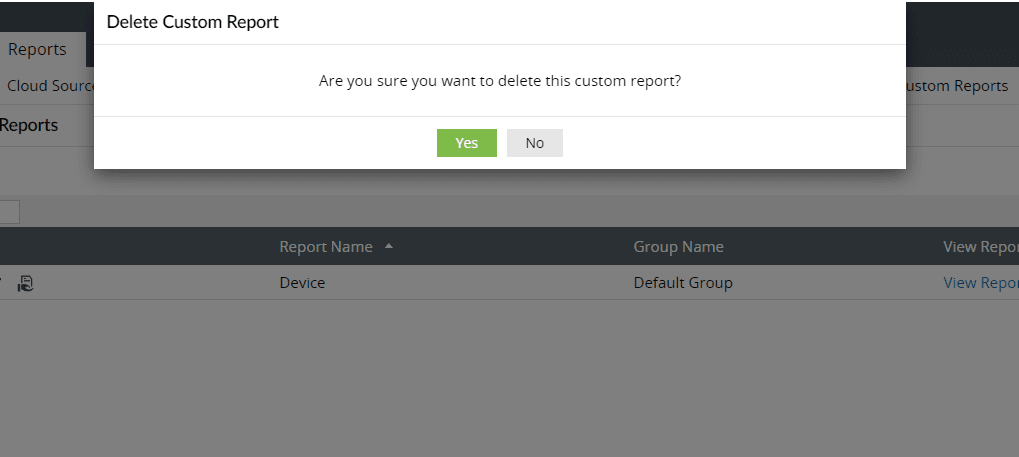
- To delete a custom-made report, click on the adjacent delete icon. Click Yes in the pop-up box that appears.

- To disable a custom-made report, click on the corresponding tick box in the Status column.

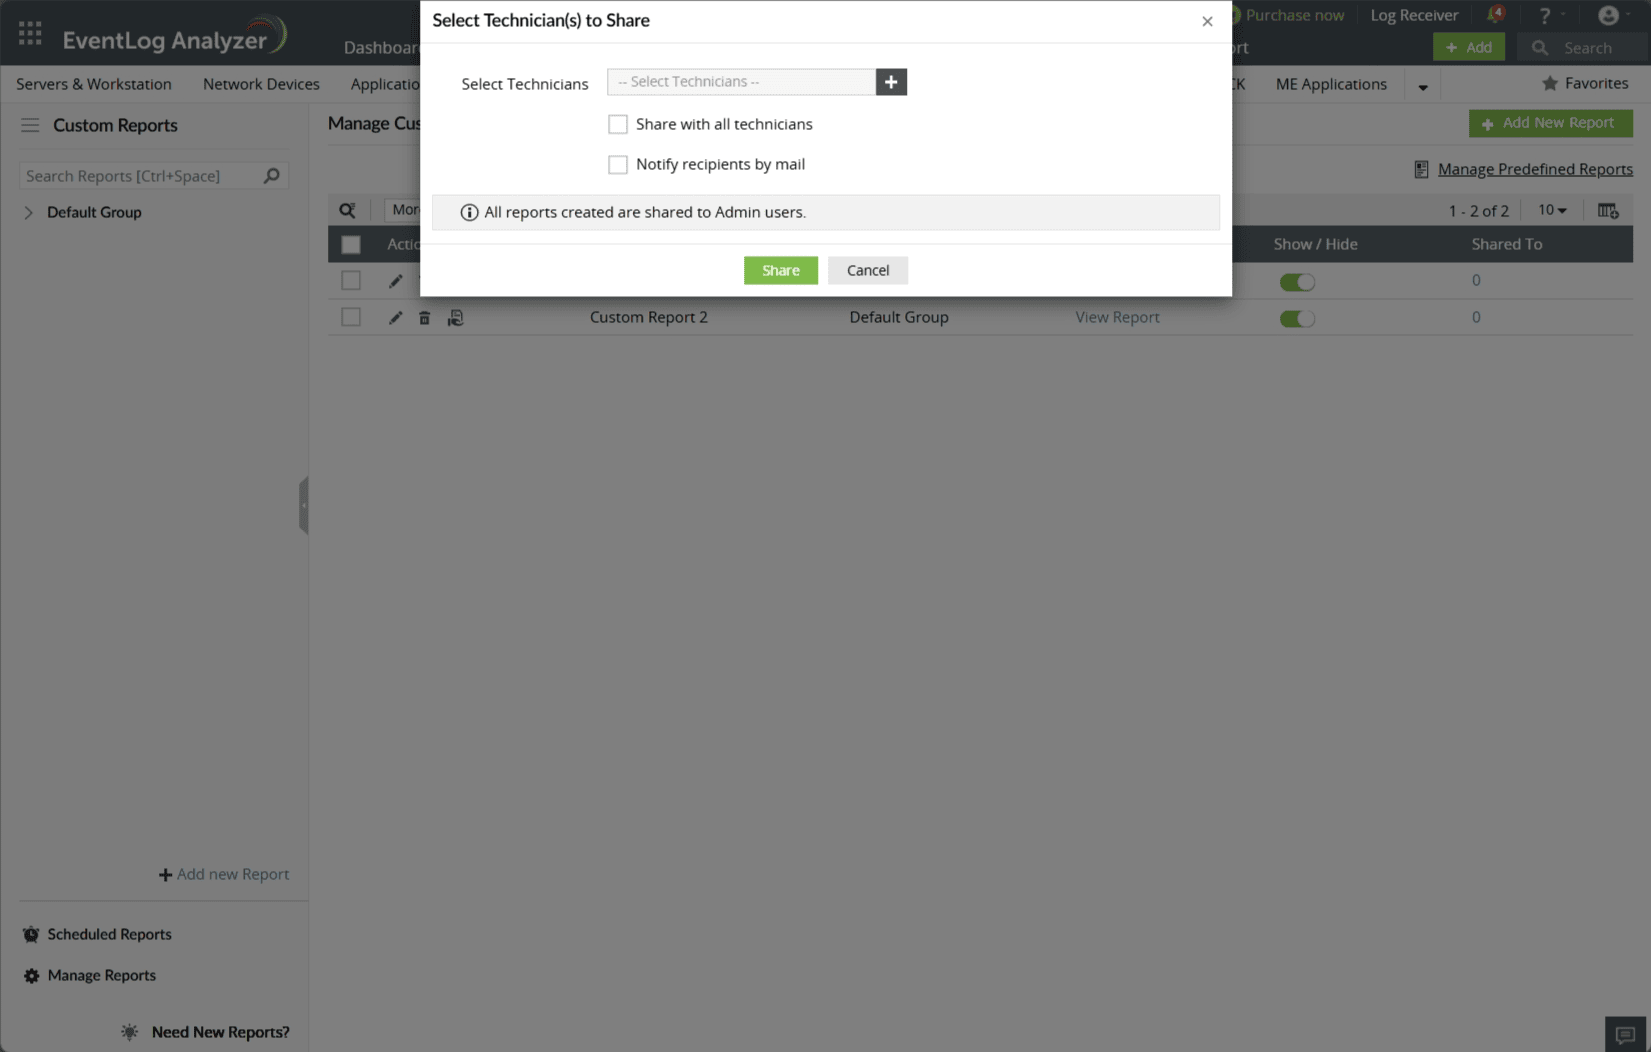
- To share the reports with technicians, hover over the report and click on the share icon that appears. Select the technician(s) and click Share.

Types of views
Tabular View
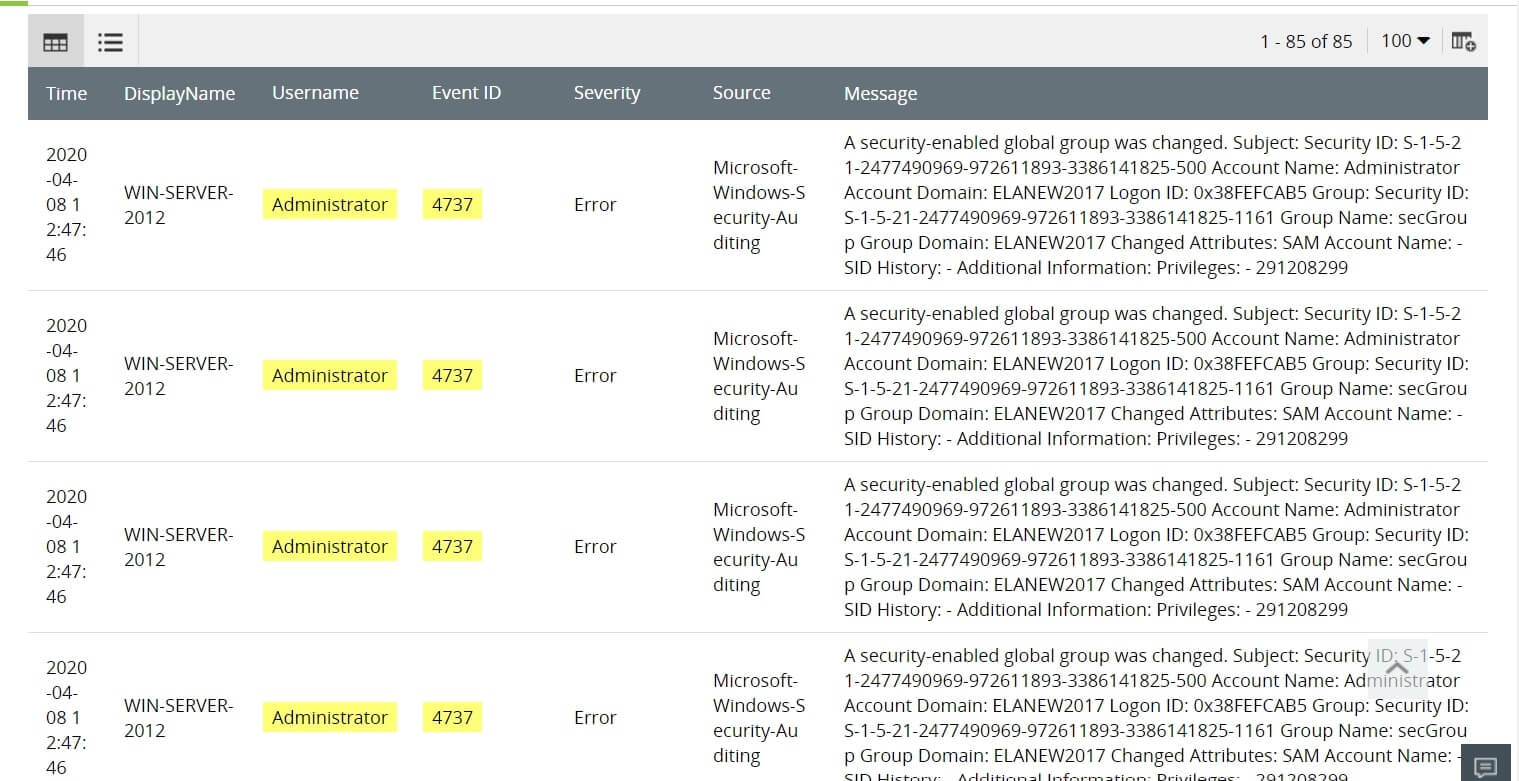
This view displays the data in the form of a simple table. You just need to frame the criteria for selecting logs for the report. You can generate different views of the same tabular view report. To create a new view, refer the Manage Report Views section.

Summary View
This view gives you a more granular representation of the log data. It allows you to select multiple criteria based on which data wil lbe displayed. After framing the report criteria, you need to select the fields based on which the summary view report will be generated.


Note: When you apply onlyone criteria, a graph would be generated. When you apply more than one criteria, a graph would not get generated, but the data would be displayed in a table.

Pivot View
This view is useful when you have to monitor particular values of the field based on which the report is generated. After selecting the report criteria, you can select the field and the values in the field that you want to monitor. Each of those values will be displayed as separate columns with the'count'.

Note: A maximum of five values can be chosen for monitoring.

Multi Report View
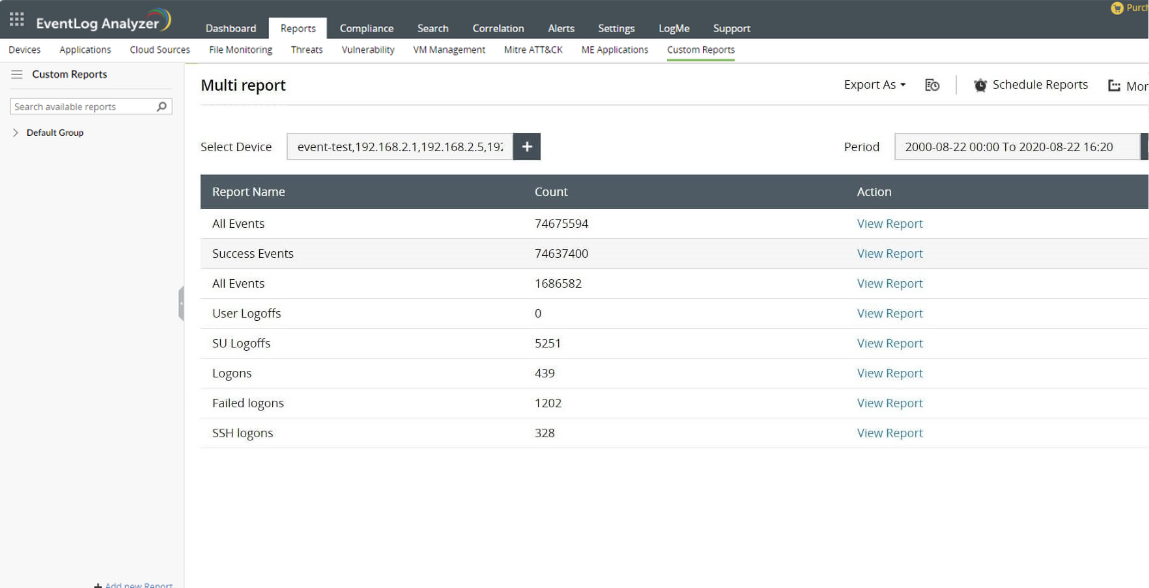
This view is useful to monitor numerous reports at one glance. It will give you a holistic view of the reports that you have added to the multi report. In this view, each report has a View Report button that navigates to the original report.

 Click here to expand
