Amazon Elastic Kubernetes Service (EKS) is a managed Kubernetes service that facilitates smooth running of Kubernetes on both AWS and on-premises. It helps guarantee high availability of your clusters and its resources across numerous availability zones. EKS clusters need to be monitored extensively to ensure hassle-free operations of various mission-critical applications running on them.
Applications Manager is a comprehensive Amazon EKS performance monitoring tool that provides in-depth insights about EKS clusters, namespaces, nodes, and pods. It identifies performance bottlenecks, evaluates your clusters' ability to scale up and launch new applications, and notifies you of errors on the go.
Become aware of Cluster Status and get to know basic cluster information such as Cluster ARN and Cluster Endpoint at a single glance. Using Applications Manager's Amazon EKS monitoring tools, keep tabs on cluster usage and get notified of increasing Cluster Memory/CPU usage. If this value keeps increasing, you may need to plan and implement scaling of cluster capacity as and when required.
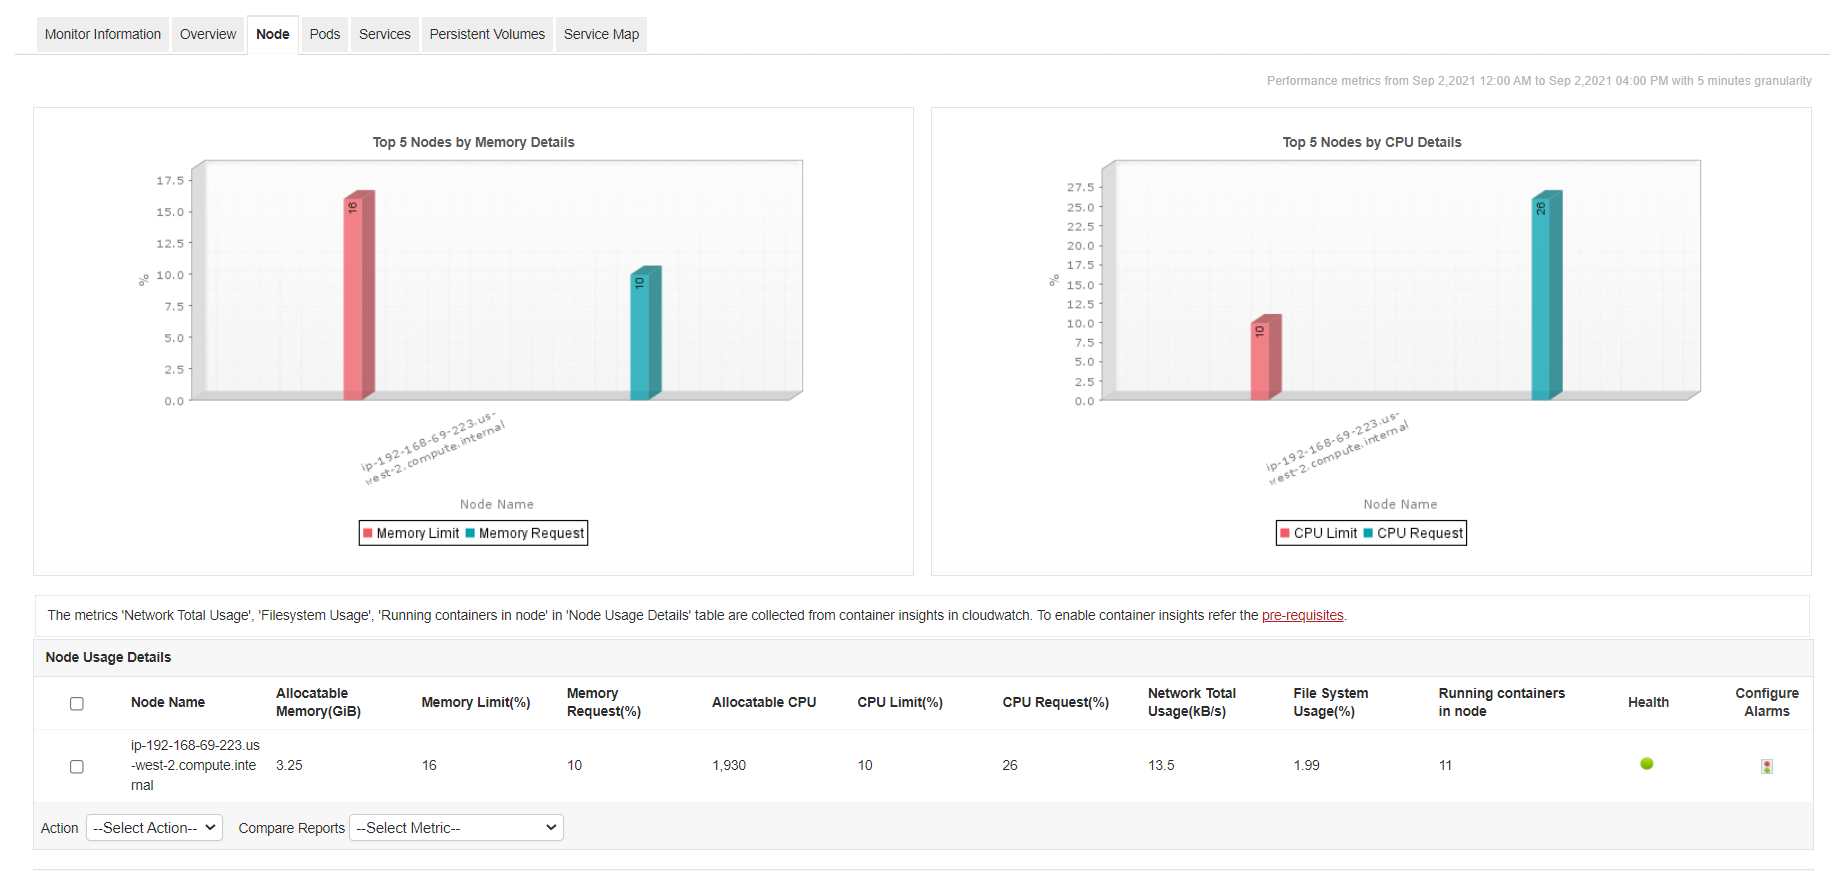
Tracking nodes and their corresponding CPU, memory and disk usage is pivotal to finding and fixing issues at the application level. Track Memory Limit and Memory Request metrics to understand overall memory usage in the node and ensure that it does not exceed the Allocatable Memory. These details help you to identify oversubscribed nodes and nodes under memory pressure, both of which can affect the cluster's ability to run workloads effectively. Similarly, Applications Manager's EKS application monitoring tool allows you to track node CPU usage constantly to avoid node throttling.

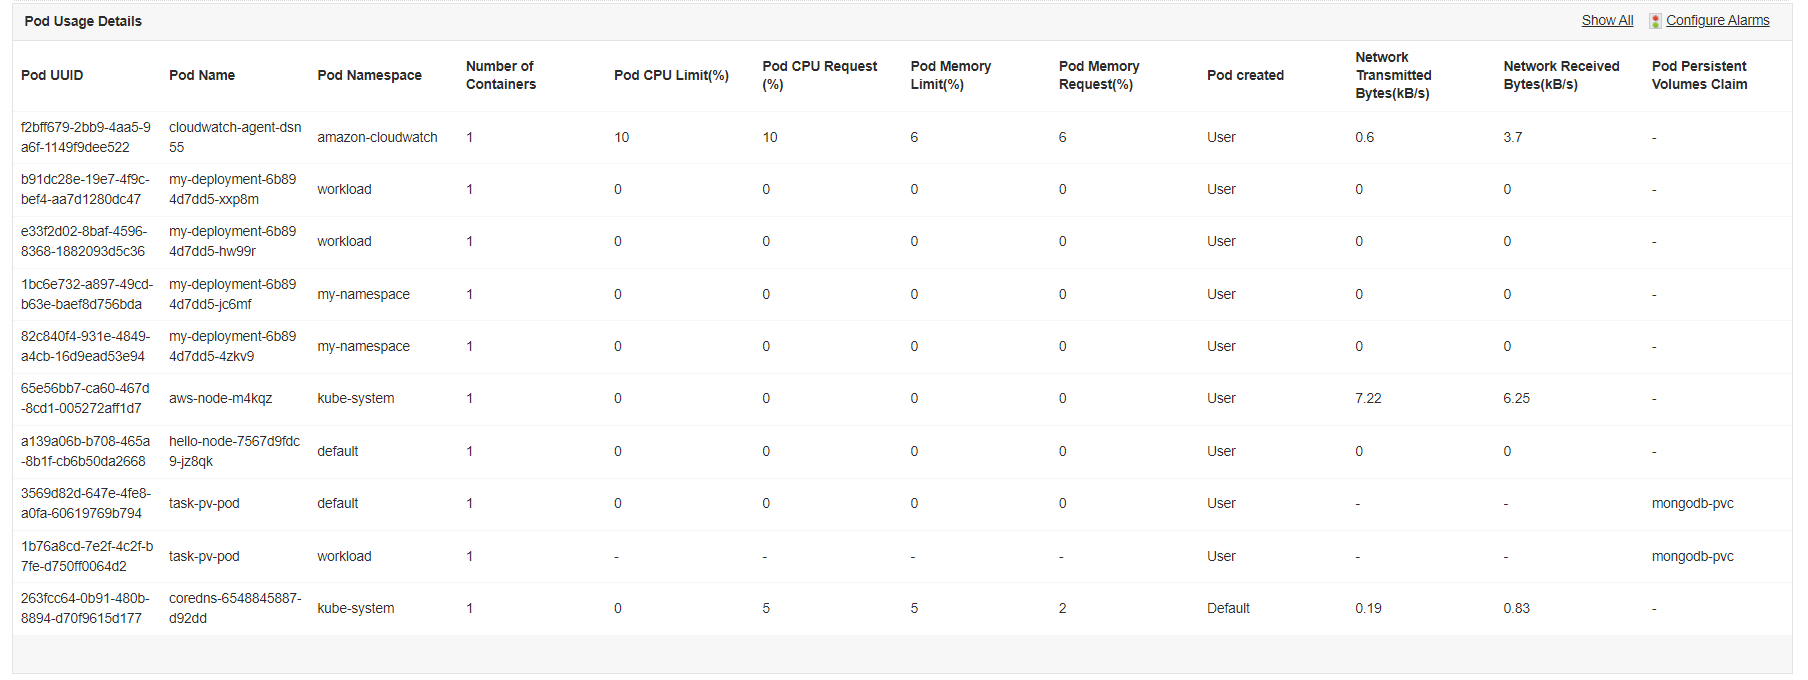
Furthermore, details about the pods in the nodes and important configuration details are also available at your disposal.

Using Applications Manager's Amazon Elastic Kubernetes Service monitoring tool, track critical pod related performance metrics and become aware of its state. Get notified of increased memory usage in pods to ensure they don't get terminated. Isolate pods with spiking memory requests. They may indicate improper configuration.

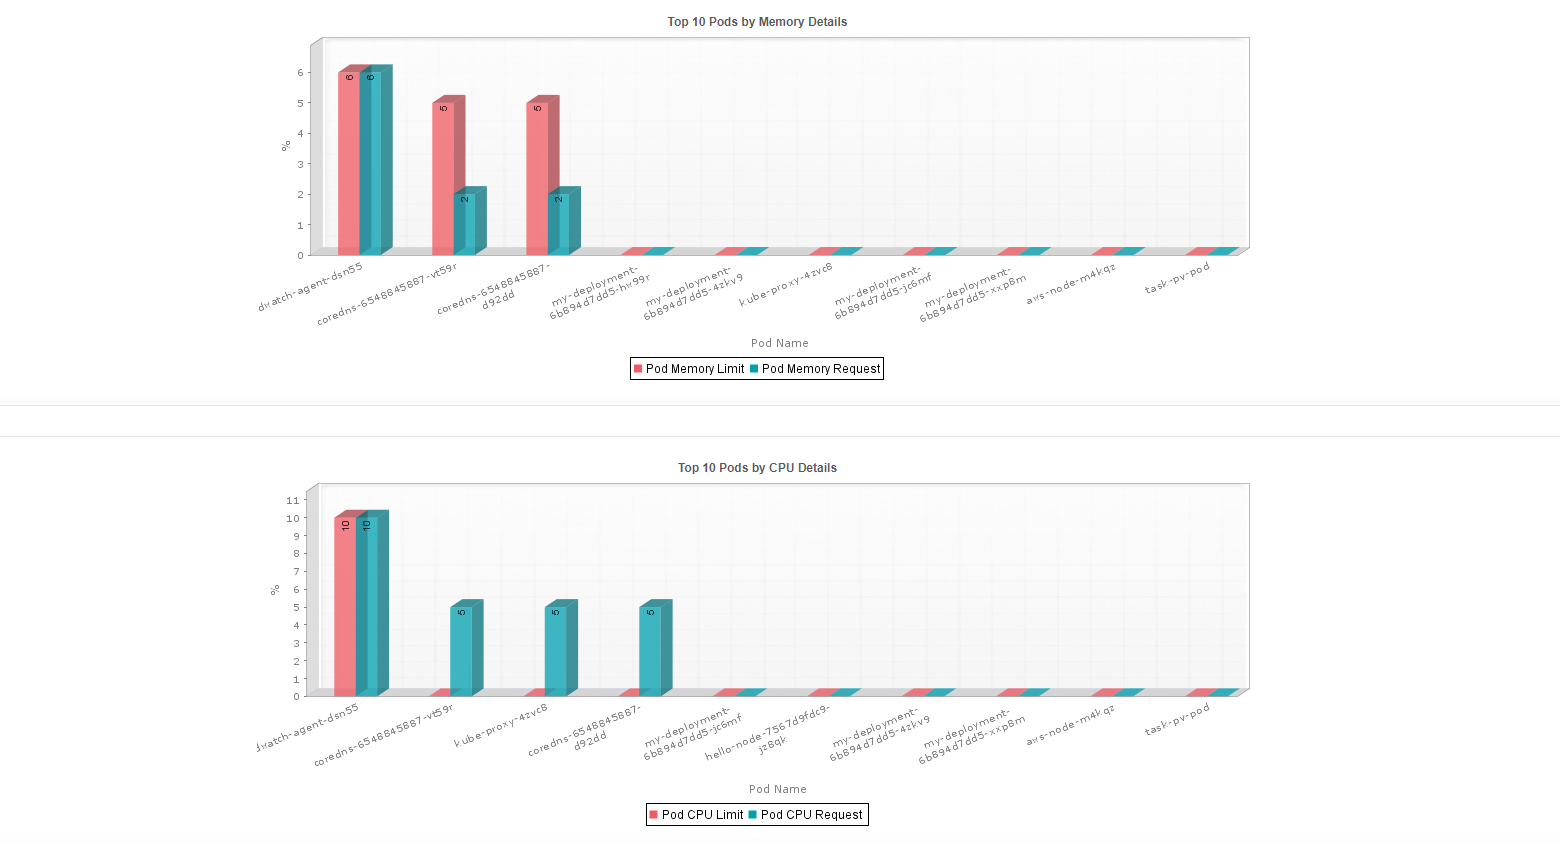
Visualize top 10 pods based on memory and CPU in graphical format to get a glimpse of overall performance of the pods at a single glance.

You can also get insights into container related metrics. Find and fix issues on problematic containers by getting notified on the Container Restarts metric.

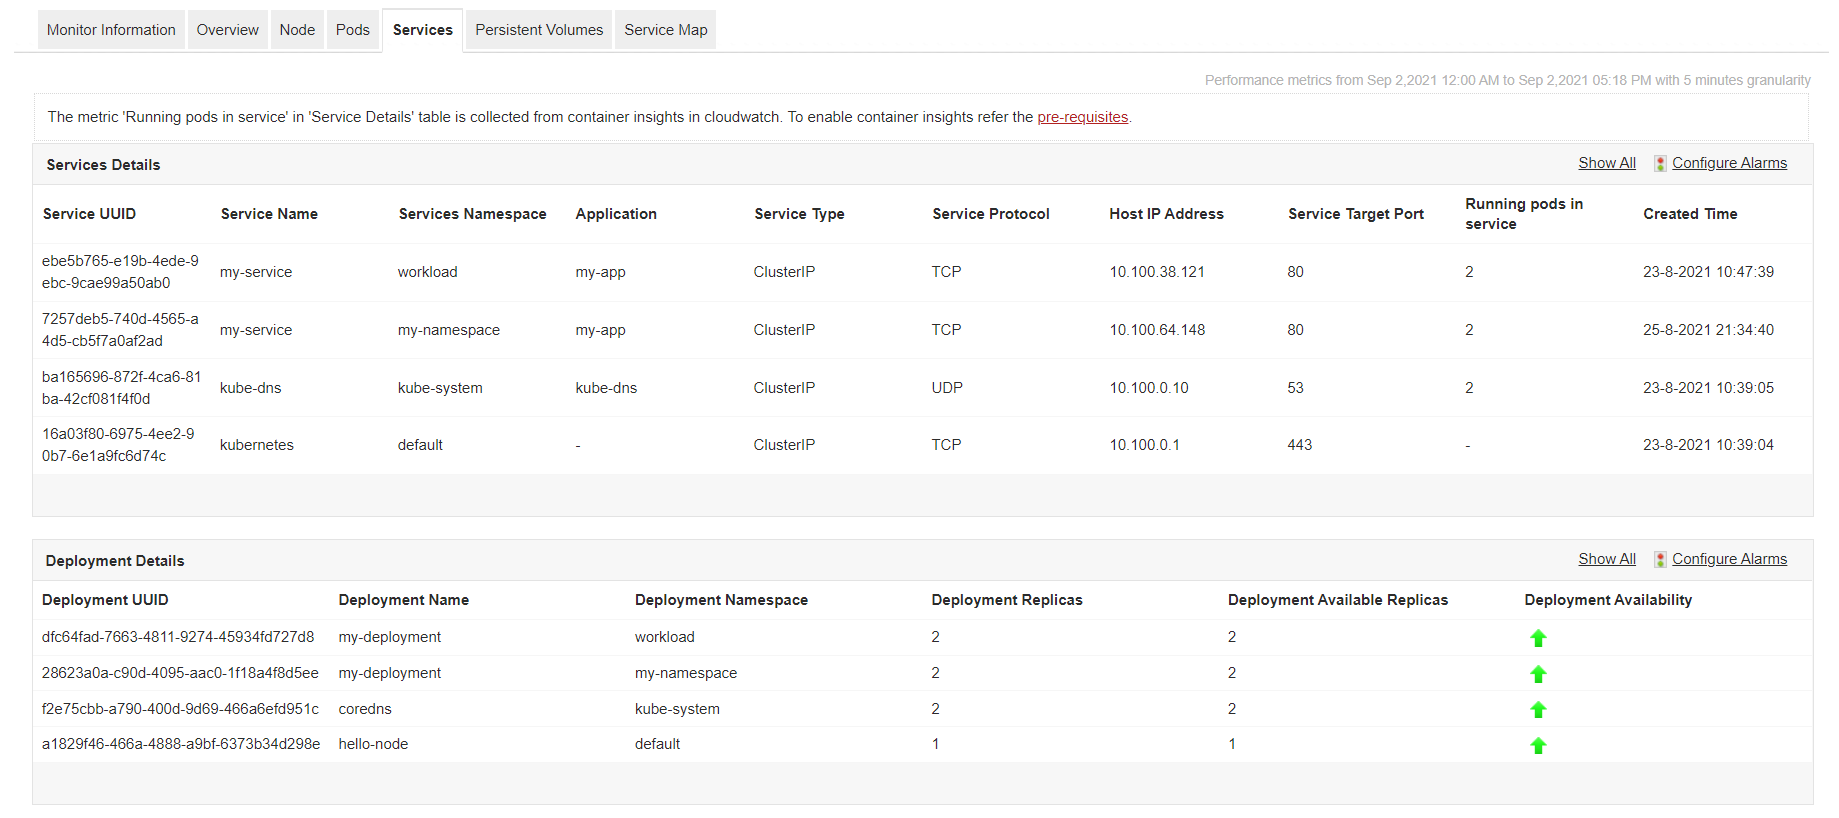
Track the services running in your clusters and become aware of Amazon EKS metrics such as Service Type, Service Protocol, and Running pods in service. Deployment details and its availability are also available at your disposal.

Get exclusive persistent volume (PV) details such as the status of PV, claim, capacity and the storage class it belongs to. You can also track Persistent Volume Claim (PVC) details such as its status, the capacity, etc.

Use the Service Map feature available in Applications Manager's EKS performance monitoring tool to visualize all service and namespace details at a single glance. The graphical display helps you to discover various components of the services and their status. Identify namespaces that are available and unavailable by recognizing the color codes in which they are represented. Hover over the service to get details such as host IP, port and number of running pods.
Applications Manager's AWS performance monitoring service supports popular services like:
Along with other AWS monitoring services, Applications Manager offers a fully-fledged 30-day free trial where you can explore the Amazon Elastic Kubernetes Service monitoring capability on your own. Download now!
It allows us to track crucial metrics such as response times, resource utilization, error rates, and transaction performance. The real-time monitoring alerts promptly notify us of any issues or anomalies, enabling us to take immediate action.
Reviewer Role: Research and Development
Trusted by over 6000+ businesses globally