Our Enterprise Edition provides an affordable, scalable solution for medium and large enterprises to monitor their applications and underlying infrastructure elements. The Enterprise Edition supports a distributed monitoring architecture and can scale up to 10,000 applications and servers.
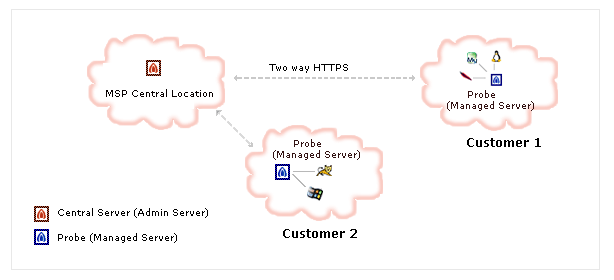
The Enterprise Edition comes with all the features offered by Professional Edition. However, Enterprise Edition's ability to scale for larger number of monitors, provide consolidated view from various restricted networks and performance comparisons and failover support are some of its key abilities. The Enterprise Edition comprises of distributed data collectors (Probe Servers) setup. It also provides a single console (central server) for consolidated reports and viewing alarms. The central server facilitates a single view to all data and reports from the various distributed data collectors (probe servers).
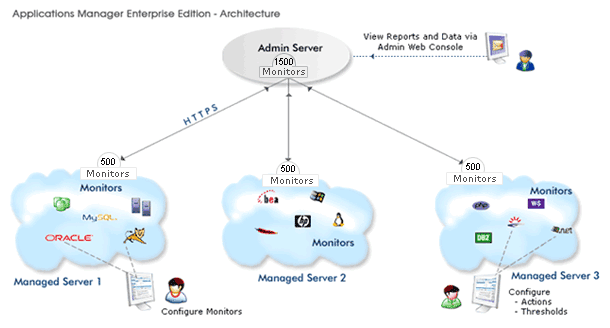
Enterprise Edition uses HTTPS as the mode of communication between the central server and the probe server. This has an added advantage for users with a very secure environment where only HTTPS is allowed across different networks. With Enterprise Edition, you can have a single view to monitoring data across these kind of high security networks by having the probe server in each of the secure networks and having the central server facilitate a single view to all monitoring information.
The Enterprise Edition comes with all the features offered by Professional Edition. However, Enterprise Edition's ability to scale for larger number of monitors, provide consolidated view from various restricted networks and performance comparisons and failover support are some of its key abilities. The Enterprise Edition comprises of distributed data collectors (Probe Servers) setup. It also provides a single console (Central Server) for consolidated reports and viewing alarms. The Central Server facilitates a single view to all data and reports from the various distributed data collectors (Probe Servers).

Enterprise Edition uses HTTPS as the mode of communication between the Central Server and the Probe Server. This has an added advantage for users with a very secure environment where only HTTPS is allowed across different networks. With Enterprise Edition, you can have a single view to monitoring data across these kind of high security networks by having the Probe Server in each of the secure networks and having the Central Server facilitate a single view to all monitoring information.
The Enterprise Edition gives the ability to scale for a large network consisting of thousands of servers and applications.
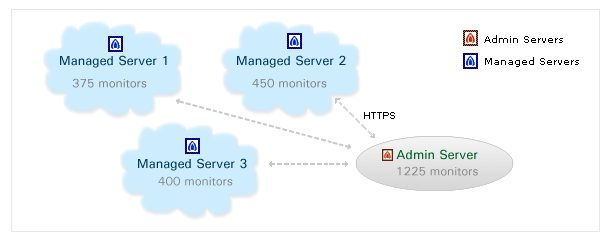
The Enterprise Edition provides a consolidated view of resources present in different restricted networks. Restricted networks are configured as probe servers and central server facilitates a consolidated view of the performance metrics.
The Enterprise Edition provides a consolidated view of resources present in different restricted networks. Restricted networks are configured as Probe Servers and Central Server facilitates a consolidated view of the performance metrics.
You can use the Enterprise Edition of Applications Manager to compare the performance of applications from different geographical locations. For example, you can monitor and perform a comparison of the response times of an e-commerce portal when accessed from UK, Singapore and USA.
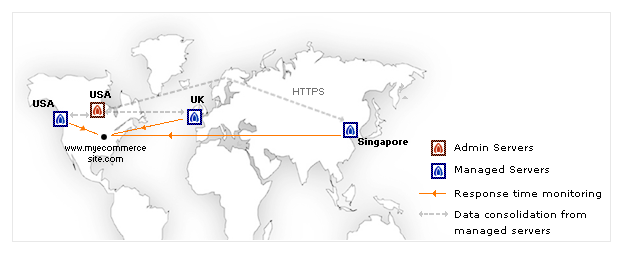
Check out the blog which gives you step-by-step instructions on how to configure Applications Manager for monitoring the response time across multiple locations. See the comparison chart between different editions.
Here's what makes Applications Manager a favorite among Enterprises:
It allows us to track crucial metrics such as response times, resource utilization, error rates, and transaction performance. The real-time monitoring alerts promptly notify us of any issues or anomalies, enabling us to take immediate action.
Reviewer Role: Research and Development
Trusted by over 6000+ businesses globally