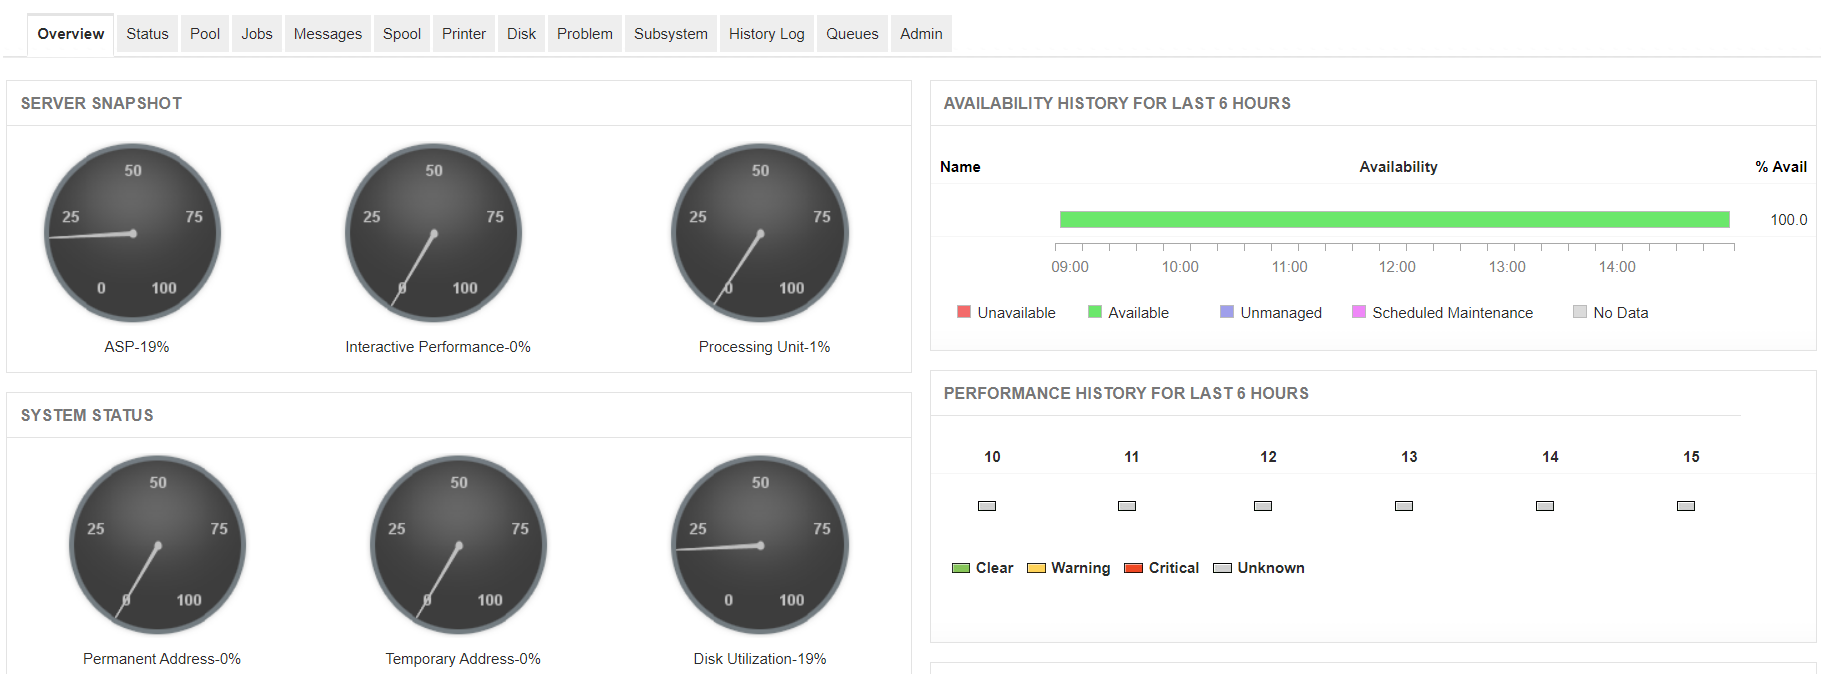
The AS/400 series, now known as IBM i, is a family of mid-sized computer systems that allow a single computer to interact with more than one user concurrently. As the IBM i architecture is used for mission-critical tasks particularly in industries that require extreme reliability, such as manufacturing, it is imperative to monitor and manage your IBM i servers.
The architecture of the AS400 iSeries server is pretty complex and monitoring it can be cumbersome. ManageEngine Applications Manager provides proactive AS400 monitoring that can help ensure high availability and improve performance of the server.
When it comes to IBM iseries monitoring, there are numerous crucial metrics that you need visibility over, to effectively manage your server. Our comprehensive IBM AS400 monitoring solution allows you to:

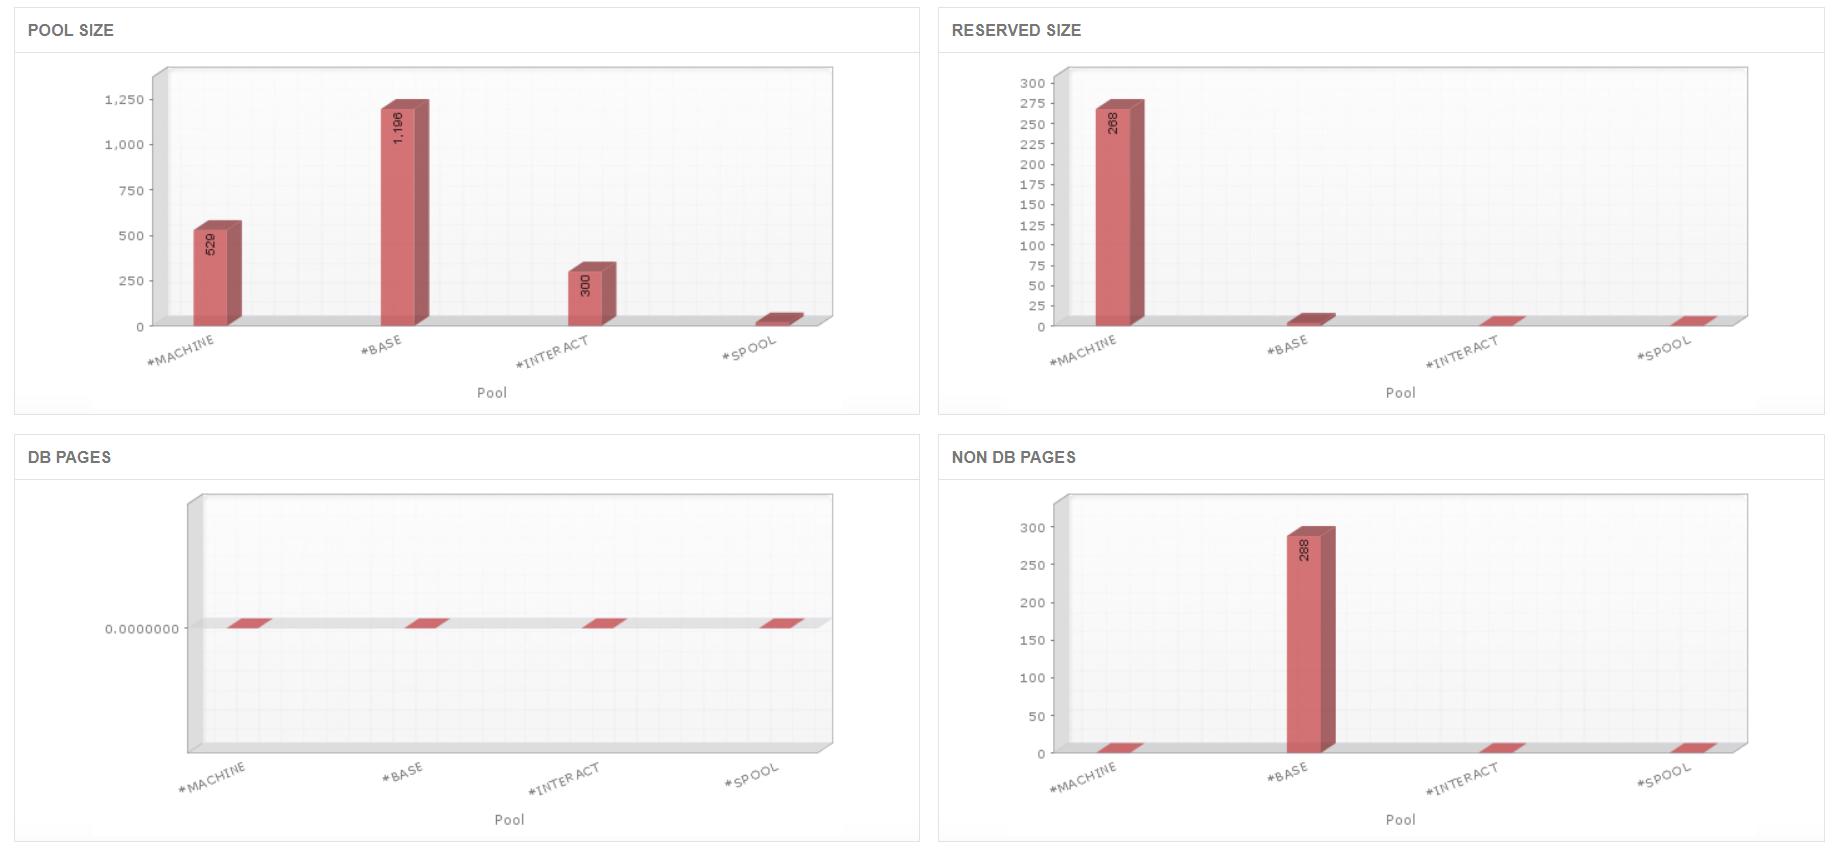
Applications Manager's AS400 monitoring tool allows you to monitor IBM i (formerly AS400/ iSeries) servers with ease and gives you comprehensive visibility into pools in the database. Pool size is the amount of working system memory assigned to the pool. Make educated decisions about the size of the pool to improve system performance by avoiding imminent problems such as Thrashing.

Faults are important indicators of a server's performance. If the fault rate is high, you may need to adjust your pool size and check your hardware for issues.

With Applications Manager's IBM i monitoring tool, get insights about the jobs running in your system-their status, the user, the CPU time, etc. With this information, identify long-running batch jobs, excessive number of jobs in job queues, and jobs that should be running but aren't, and take necessary actions to effectively improve server performance.
Learn more about monitoring jobs.

With Applications Manager's IBM i system monitor, you can also become aware of the increasing load on your subsystems to avoid slow work performance in your server.
Learn more about monitoring subsystems.

IBM i server has a System operator queue that receives and replies to messages from the system. When a system issue occurs, the server issues a message to the QSYSOPR message queue. With Applications Manager's IBM iSeries monitoring, you can become aware of inquiry messages that expect a reply and handle them accordingly.
Learn more about monitoring messages.

Under some circumstances, the server writes a system problem report to the problem log/history log. You can identify these problems with our AS400 monitoring tool and attend to them to avoid their recurrence.
Learn more about monitoring history logs.

Queues in IBM i system receive requests that need to be processed and send messages that result from processing the requests. The messages are sent back to the requester. Applications Manager's IBM i performance monitoring enables you to manage pre-defined system library data queues and objects. If you find an increased number of jobs in the queues, it might indicate that the jobs are caught behind a long-running batch job that you may need to remove to improve the responsiveness of the server.
Learn more about monitoring queues.

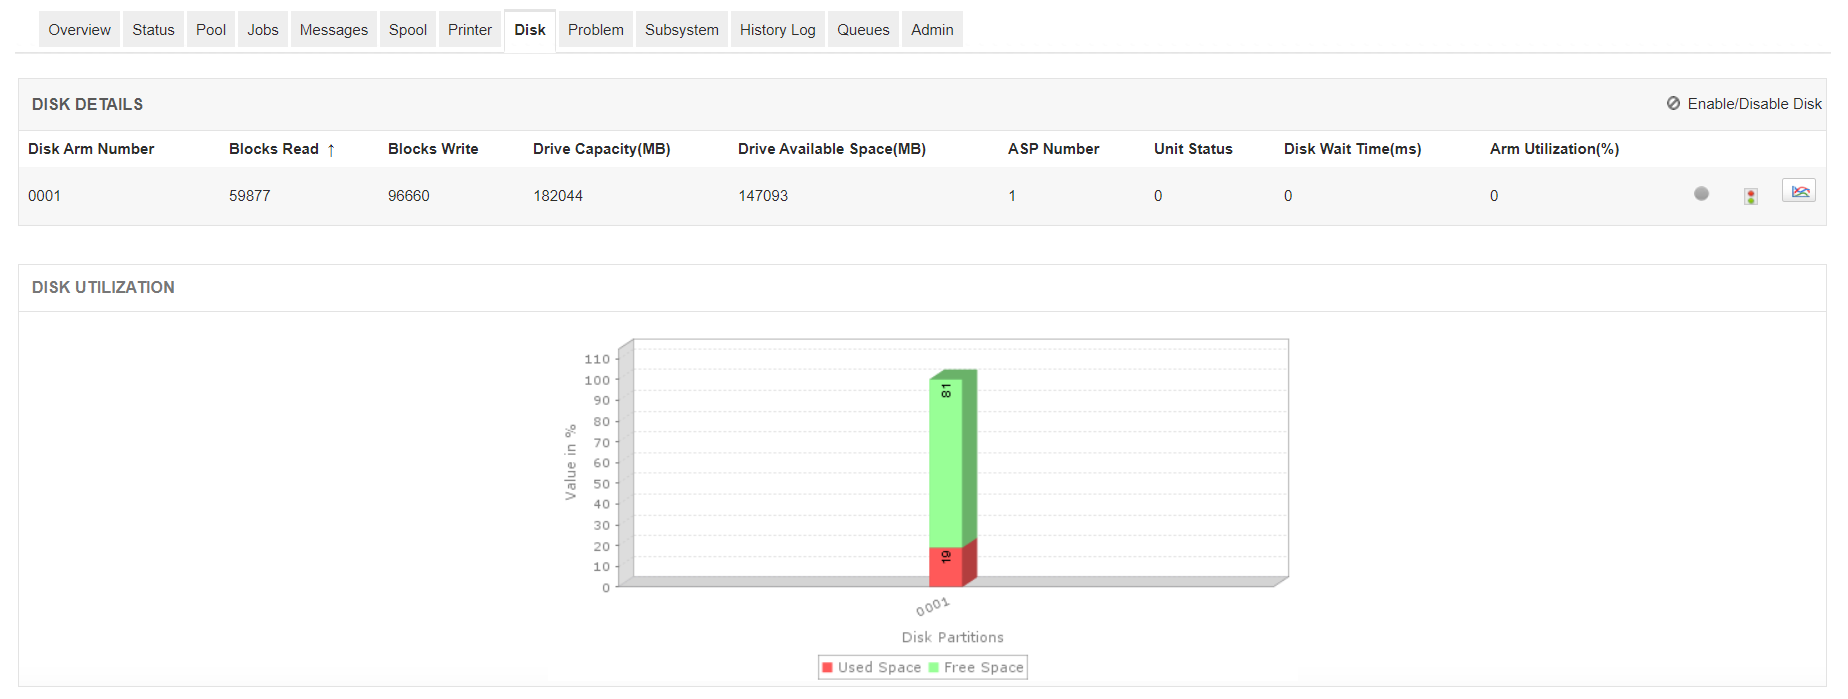
Applications Manager's iSeries performance monitoring capabilities include tracking various device metrics of the IBM i server:


Applications Manager's IBM iSeries monitoring tool enables you to perform various admin operations. Edit various values of IBM i server and get details about specific jobs by accessing the job log and get insights about the user by querying it in a non-interactive command shell.

Applications Manager's IBM i server monitoring tool comes with a dynamic reporting feature that supports both numerical and graphical representations of key attributes. You can monitor your IBM i server performance and make learned decisions regarding your server using trend analysis, forecast and inventory reports!
Explore all the features of Applications Manager's AS400 monitor by downloading a 30-day free trial now!
It allows us to track crucial metrics such as response times, resource utilization, error rates, and transaction performance. The real-time monitoring alerts promptly notify us of any issues or anomalies, enabling us to take immediate action.
Reviewer Role: Research and Development
Trusted by over 6000+ businesses globally