Azure Managed Databases comprises a set of services offered by Microsoft Azure to help ease the operational workload of developers when it comes to handling and scaling databases. Due to its flexible integration with other Azure services, IT administrators can leverage a wide range of built-in features to develop and deploy their applications without having to worry about database management. Azure Managed Databases service also helps automate tasks to ensure high availability for seamless development and deployment of business-critical applications.
However, when it comes to large-scale deployments, it becomes essential to employ a monitoring tool that conducts regular maintenance checks over your Azure Managed Databases services to seamlessly manage and maintain database resources and prevent unnecessary application downtime and service disruptions. Additionally, it can also help you prevent paying extra for unused database resources.
Applications Manager is a cloud monitoring tool that can keep track of a wide range of Azure services. To help database administrators keep track of their Azure database instances, Applications Manager offers monitoring support for the following Azure Managed Databases:
With a wide range of monitoring features, Applications Manager enables you to optimize performance to ensure higher availability of deployed applications. Applications Manager can be used to monitor both single and flexible server configurations. You can also identify the replication status of your single server—either 'Replica' or 'Master'—so that you can gain deeper performance insights into the metrics of each replication type. Keeping a close watch on your failover targets using Applications Manager can help ensure higher availability and prevent potential instances of downtime.

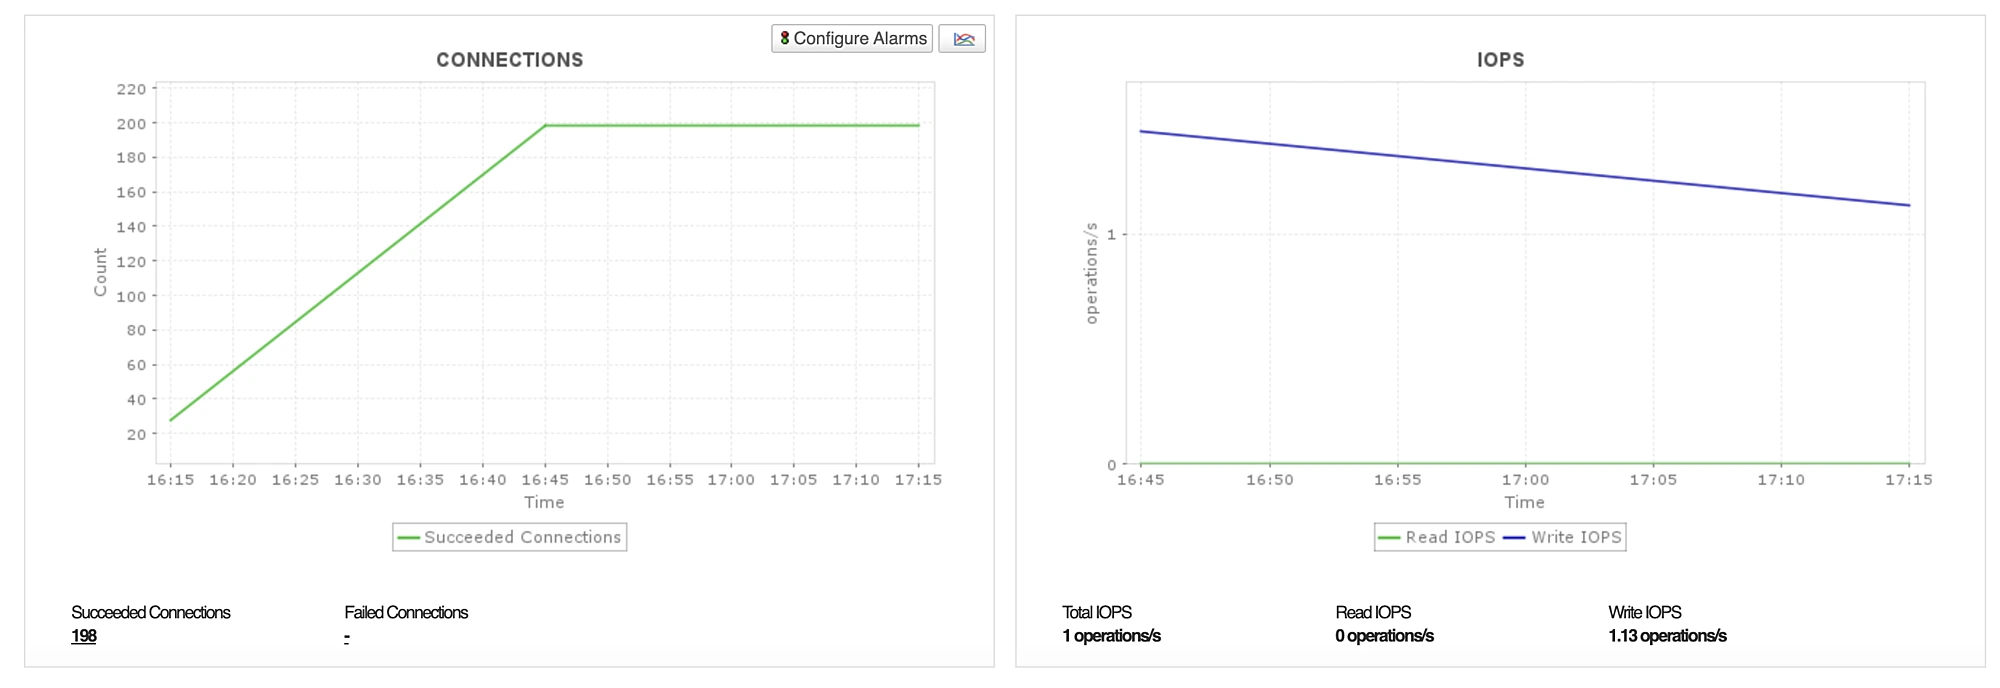
Applications Manager has a comprehensive dashboard panel to monitor your Azure Database for PostgreSQL service where you can get an overview of how efficiently your database components are performing. You can also monitor resource utilization, network bandwidth, and other metrics to identify underutilized or overutilized resources and make adjustments accordingly. By assigning thresholds to each KPI, you can get notified every time there is a deviation from the optimal range. You can also make arrangements to optimize costs and ensure that sufficient resources are allocated.
Visit our Azure Database for PostgreSQLhelp page to learn more about the parameters monitored.
When it comes to managing your Azure database for MySQL service, Applications Manager monitors performance of your flexible and replica server configurations at a granular level. Our Azure database monitoring tool makes it easier for IT admins to maintain servers that are being used for compute-workloads as they levy a huge burden on operational costs.

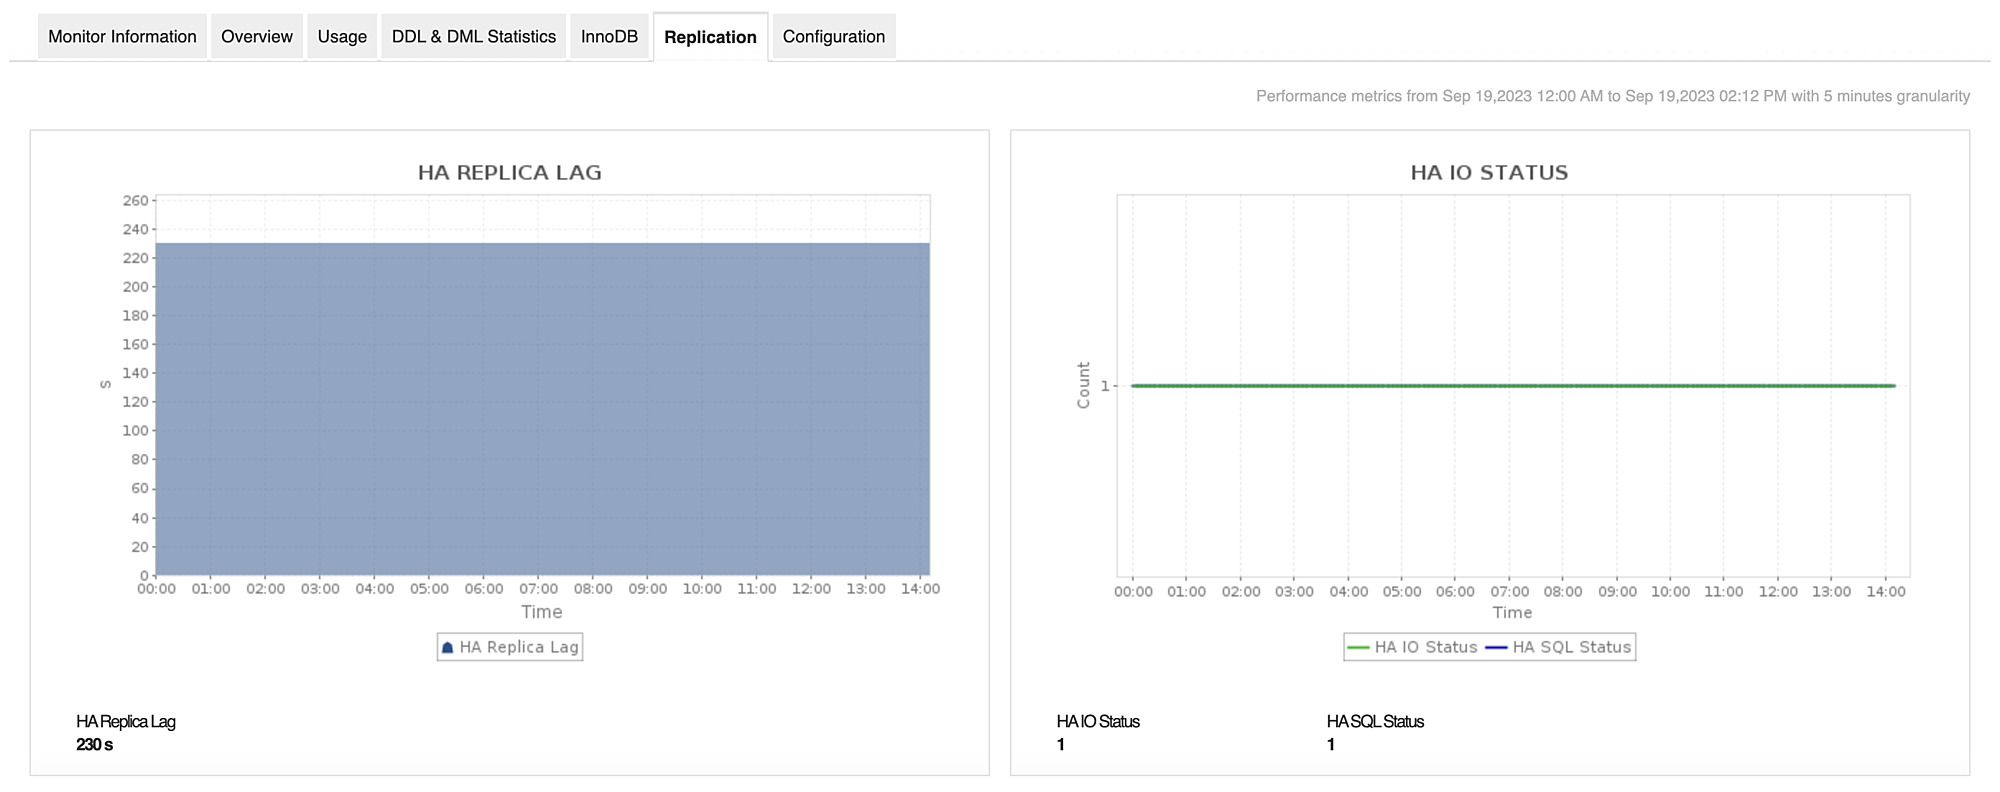
In addition, our Azure database monitor can track the performance statistics of database servers so that performance optimizations can be made to support product workloads as efficient as possible without compromising on availability. Some of the performance statistics offered by Applications Manager include server utilization, traffic flow rate, database statement executions, InnoDB performance, replication status, and more.
As Azure Database for MariaDB is widely preferred for its dynamic scalability, it becomes essential to employ a monitoring software that can handle application environments ranging from those with basic workload requirements to those with a complex dependent architecture. For such scenarios, Applications Manager has the capability to monitor the performance level of your database servers at different stages to make server management a hassle free process. Our software monitors the network traffic, server usage, and storage components of your Azure Database for MariaDB server.
Azure CosmosDB is a highly distributed database which requires a level of precision that grants visibility into each component that can only be offered by Azure monitoring tools like Applications Manager. It helps ensure that application development to deploy happens at a faster pace without compromising on the response rate and availability.
Applications Manager has dedicated monitors that can be assigned to track the performance of APIs supported by Azure CosmosDB that include Azure table, NoSQL, MongoDB, Apache Cassandra, and Gremlin. It furnishes a wide range of performance metrics ranging that are native to each database through visual graphs for quick troubleshooting.
Azure SQL Elastic Pool offers a seamless and cost-efficient solution for sharing resources among multiple databases within the same pool, particularly beneficial for workloads with fluctuating demands. To uphold optimal performance standards, proactive monitoring is paramount.
Applications Manager empowers you to monitor resource utilization at both the database and instance levels. By tracking sessions and storage-related metrics, it provides insights into database workloads, ensuring timely alerts when storage limits are approaching.
Monitoring Azure SQL elastic pools help you to ensure optimal performance, scalability, and security, while also reducing costs and improving system reliability and user experience.
Applications Manager has all the right set of tools required to understand the performance behavior of the Managed Database services that are part of your Microsoft Azure environment. It is easy to setup, configure, and use. For more hands-on experience of our Azure database monitoring tool, download a 30-day FREE trial now!
It allows us to track crucial metrics such as response times, resource utilization, error rates, and transaction performance. The real-time monitoring alerts promptly notify us of any issues or anomalies, enabling us to take immediate action.
Reviewer Role: Research and Development
Trusted by over 6000+ businesses globally