SilverStream (now known as Novell exteNd) Application Server is a comprehensive, J2EE certified platform for building and deploying enterprise-class Web applications. With Applications Manager, your SilverStream server monitoring becomes easier as it monitors the performance and availability of your servers.
SilverStream monitoring includes delivering comprehensive fault management and proactive alarm notifications, checking for impending problems, triggering appropriate actions and gathering performance data for planning, analysis, and reporting.
A low response time of your server enables it to perform optimally. While Applications Manager tracks your server response times, it also keeps a tight check on the memory utilized by your server along with their GC Count. Applications Manager instantly alerts you when it detects any abnormal behavior of the SilverStream server, thus enabling you to eliminate bottlenecks before it affects end users.

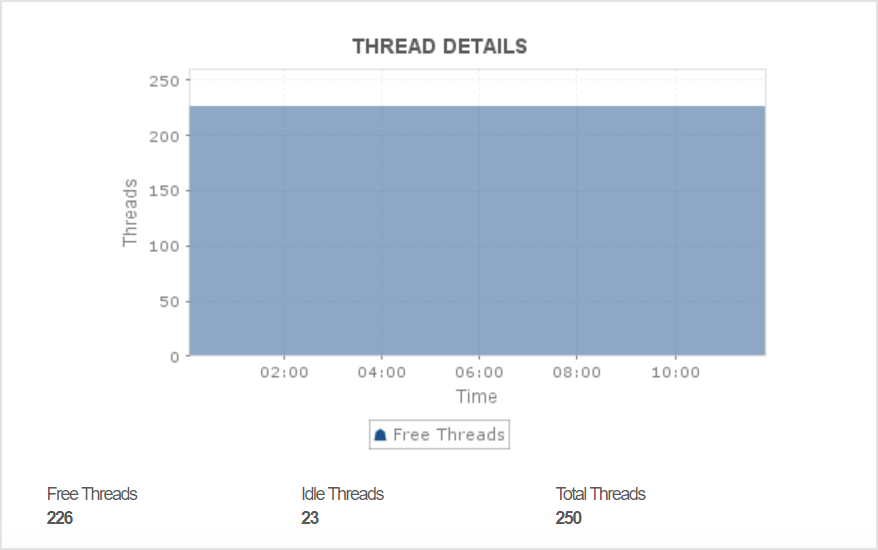
Understanding thread activity can give clear insight into the current operational status of your SilverStream server. The total number of threads along with details such as number of free and idle threads indicate how much load your server is processing. Therefore, it keeps an eye for the thread stats and identify and troubleshoot bottlenecks quickly.

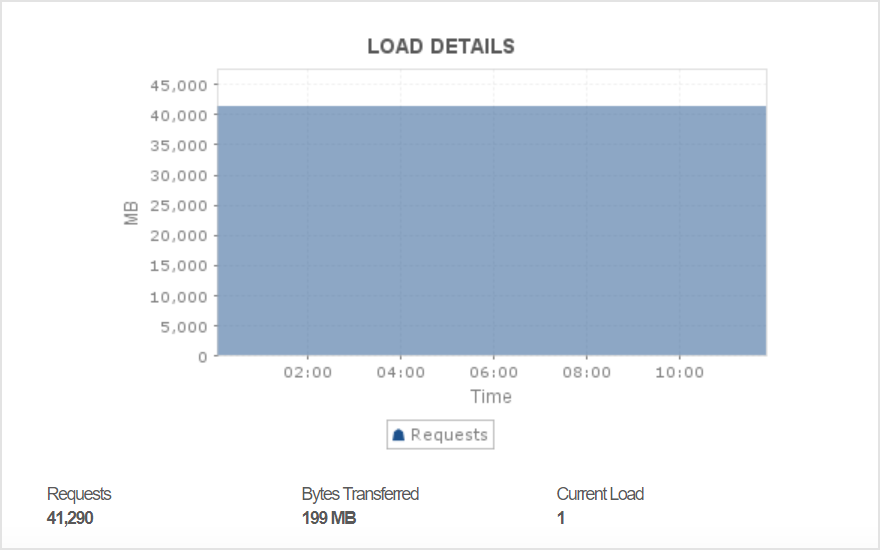
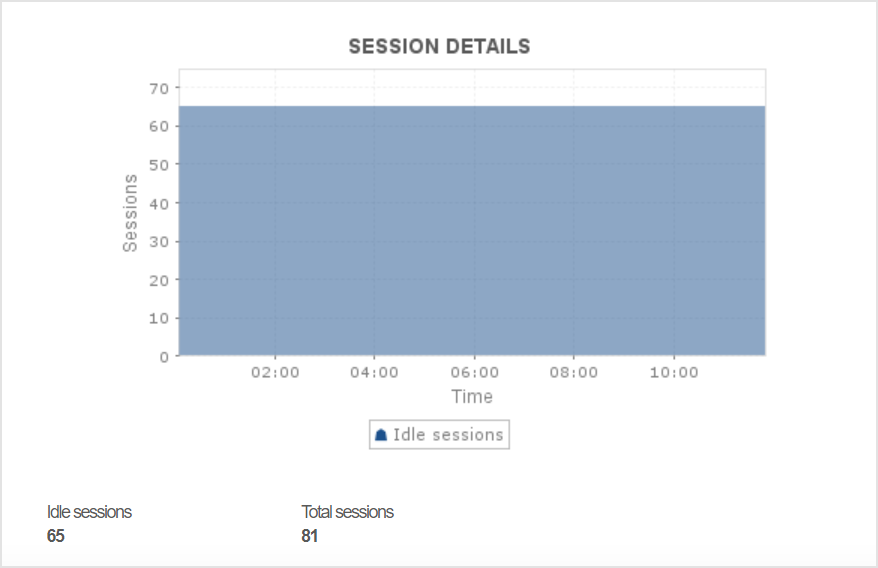
View load metrics like bytes transferred and the number of requests processed along with the number of loads currently being used on the server. Also, you can view sessions stats like total sessions available and number of idle sessions, thereby keeping track of the health and the status of different sessions in the server.


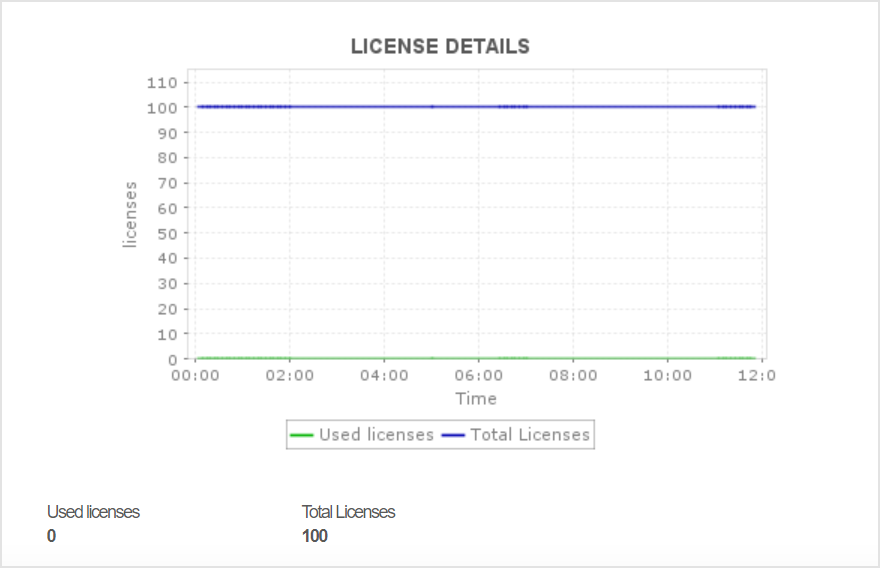
Monitor all the license details such as total licenses available and number of licenses used on the application server. As a result, it helps the IT administrator easily analyze and grant access to its users accordingly.

Overall, Applications Manager automatically diagnoses, notifies, and corrects performance and availability problems not only with SilverStream Servers, but also with other servers and applications in the entire IT infrastructure.
For code-level insights into the web applications running on SilverStream, please take a look at the
APM Insight for Java. This feature allows you to view Java method level breakup of response times. It enables end-to-end web transaction monitoring, from URL to SQL queries of a web application, and provides the time taken in the various tiers like Web, Java, EJB, and JDBC. Application admins can easily troubleshoot problem areas by obtaining the slow URLs and take a look at the trace (method level) all the way to the SQL query.
It allows us to track crucial metrics such as response times, resource utilization, error rates, and transaction performance. The real-time monitoring alerts promptly notify us of any issues or anomalies, enabling us to take immediate action.
Reviewer Role: Research and Development
Trusted by over 6000+ businesses globally