Nutanix leverages hypervisors like vSphere, Nutanix AHV, VMware ESXi, or Microsoft Hyper-V to combine compute and storage into a single 'Hyperconverged' software. Despite its many advantages, Nutanix hyperconverged infrastructure is quite complex, and like every other application, requires adequate performance monitoring to detect issues. Applications Manager's Nutanix monitoring tool helps remove the complexities of infrastructure management by providing a simple dashboard of all the essential details about Nutanix parameters.

In a Nutanix-inclusive environment, establishing effective, continuous monitoring of Nutanix implementations is critical. Ideal nutanix monitoring tools closely monitor metrics related to clusters, storage and VMs in the Nutanix system to identify issues and nip them in the bud before they start affecting businesses. With Applications Manager's Nutanix management software, you'll get visibility into your hyperconverged environment, from storage and compute infrastructure to individual virtual machines.

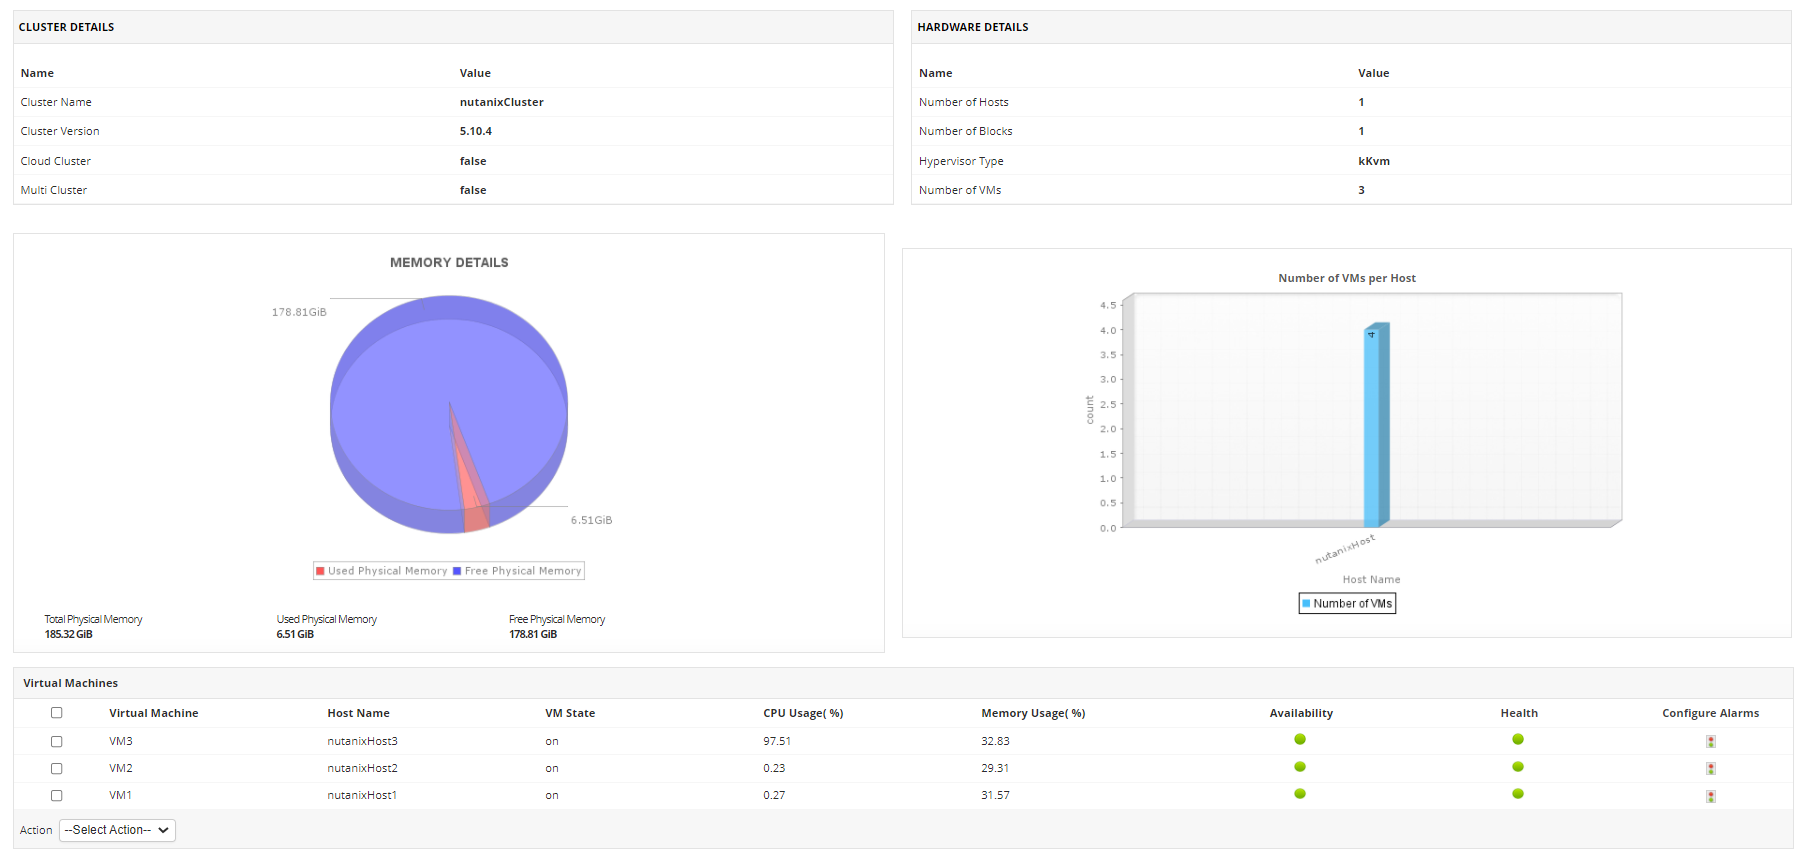
There are numerous metrics which require constant monitoring in a Nutanix deployed architecture. Applications Manager's Nutanix monitoring software provides insights on key metrics that are not only exclusive to the Nutanix system but also on various elements in the IT infrastructure. Discover the virtual machines in your Nutanix cluster automatically, track their health and availability, and monitor the resource consumption of each VM. Information about cluster and the hardware Nutanix is hosted on is also presented in the dashboard.
Let's take a look at the important Nutanix performance metrics which you can monitor with Applications Manager:
With Applications Manager's nutanix performance monitor, get information about the system Nutanix is hosted on. Details about various resource usages like CPU, disk, hypervisor, and memory is at your disposal which helps in efficient resources allocation and management.
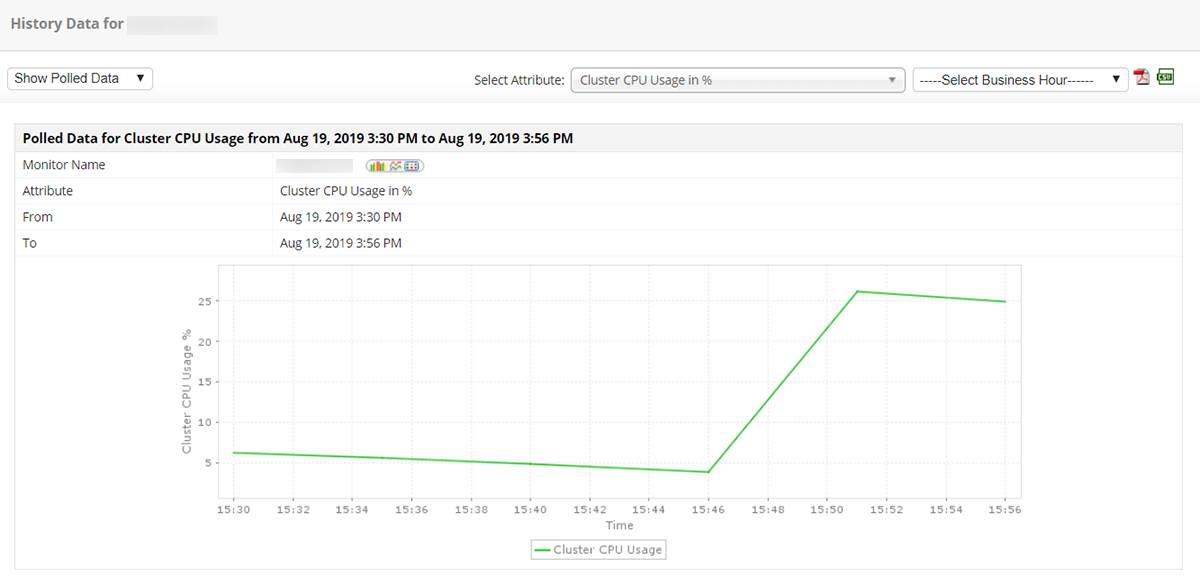
Input/Output details can reveal a lot about the performance of your system. With Applications Manager's Nutanix monitoring tool, you get to visualize the cluster I/O operations which are crucial metrics to monitor in a Nutanix system. You can also obtain cluster stats like Cluster IOPS, Cluster Bandwidth and Cluster Latency with read/write breakdown for each operation.
See how Applications Manager's Nutanix hci software caters to your Nutanix monitoring needs. Schedule a personalized demo today.
Request DemoWith Applications Manager's Nutanix monitoring capabilities, monitoring and tracking storage becomes easy. Get extensive details about disk and storage container usage like free, used and total capacity of all storage units, which will aid in storage management.
Applications Manager's Nutanix monitoring system shares essential details about the alerts and events generated by Nutanix. It provides details about the issues which trigger alerts like the severity of the issue, entities affected by the issue, whether it was resolved automatically or not, resolved time and many more. Information about the events such as creation time, message, entities it affects, etc. are also given.
The Nutanix monitor also collects metrics on all the virtual machines in the Nutanix system. It provides stats on resource consumption, storage consumption, IOPS, controller bandwidth and latency, etc. You can also configure Guest OS for the virtual machines to monitor and track the processes & services running on the server on which the VMs are hosted.
Applications Manager enables you to control VMs in your Nutanix environment from the Nutanix performance monitoring console. Perform actions like starting and stopping VMs without having to switch tabs.
One of the areas where IT administrators struggle is troubleshooting which can be time-consuming. Identifying the source of various performance bottlenecks adds to the effort and prolongs the troubleshooting process. Applications Manager's fault management system comes with a root-cause analyzer which automatically identifies the root cause of issues, so that you can resolve them faster and with ease.
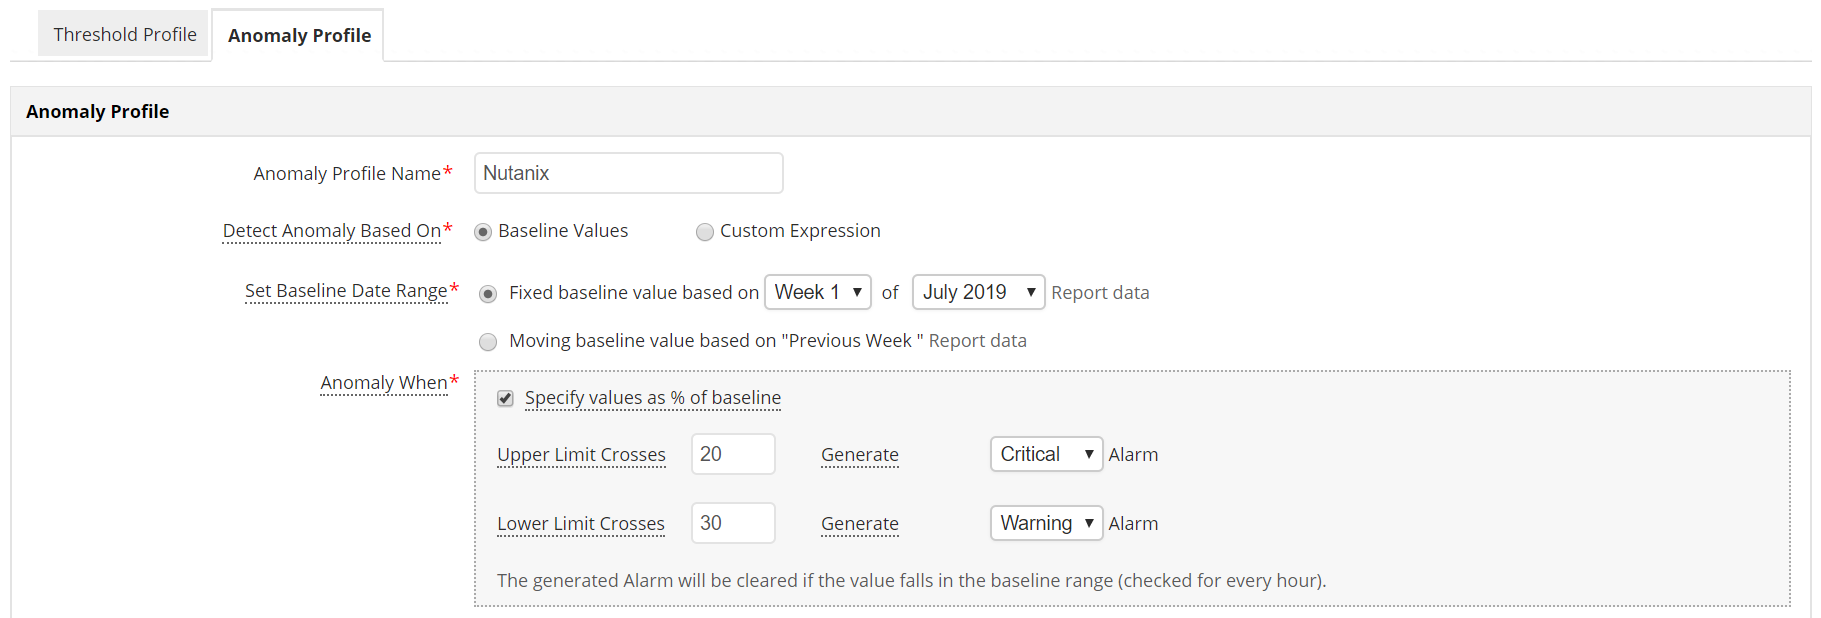
You can also configure thresholds and anomaly profiles for important parameters, and associate alerts and automated actions— like E-mail or SMS action, which will be performed when the values deviate from standard values— to them. Setting up anomaly profiles can help you identify gradual performance degradation, so you can take action before end users are affected. You can set baseline limits as a percentage of a fixed baseline value or you can opt for "Dynamic baselining" where the data will be compared with the previous week's values.

Applications Manager's powerful reporting facility provides extensive graphical reports of key attributes. You'll be able to make educated decisions regarding your Nutanix infrastructure with the help of various analytical reports that Applications Manager offers.
While trend analysis reports allow you to compare and analyze historical performance trends based on hourly/daily/weekly reports and heat charts, forecast reports employ machine learning techniques to predict growth and utilization trends in the future. Capacity planning reports are available for Nutanix VMs —these reports help admins see which VM servers are overutilized, which are underutilized or idle and distribute load accordingly in order to prevent a server overload or crash.

It allows us to track crucial metrics such as response times, resource utilization, error rates, and transaction performance. The real-time monitoring alerts promptly notify us of any issues or anomalies, enabling us to take immediate action.
Reviewer Role: Research and Development
Trusted by over 6000+ businesses globally