Ensure optimal performance with 24x7 Postgres monitoring
To effectively monitor Postgres performance, it's crucial to have visibility over several key metrics. Our Postgres database monitoring tool allows you to:
- Monitor active connections: The number of active connections impacts server performance. Keep track of the current connection count and analyze user sessions to terminate idle ones that unnecessarily slow down the server.
- Analyze response times: High response times in the database indicate a decline in performance. If response times are increasing, analyze long-running queries to identify potential issues.
- Track disk usage: Monitor PostgreSQL disk usage statistics to analyze server efficiency. Rapid increases in disk usage may suggest frequent access to storage, slowing down the network. You may have to investigate why data retrieval isn't happening from the cache.

Accelerate performance with query-level insights using Postgres monitoring
Monitor Postgres queries to gain insights into your database workload. Proactive PostgreSQL query monitoring ensures a smooth-running database environment and a positive user experience for applications relying on it. Applications Manager's Postgres queries monitoring capabilities allows you to obtain about:
- Top 10 queries by CPU: Monitoring the top CPU-consuming queries helps identify which queries are taxing your server resources the most. Analyze these queries so you can optimize them to reduce CPU usage and enhance overall performance.
- Long-running queries: Tracking long-running queries is essential to prevent them from degrading database performance. Identify and optimize these queries to improve response times and resource utilization significantly.
- Top 50 table row details: Obtain detailed insights into the top 50 queries to get a comprehensive overview of your database activity. This can help in pinpointing non-essential queries running in the background, allowing you to isolate and address them to prevent performance degradation.

Monitor Postgres sessions to identify bottlenecks quickly
PostgreSQL sessions can become blocked due to various reasons, such as idle transactions, concurrent access to the same resource, or prepared transactions. With Application Manager's PostgreSQL monitoring software, you can identify blocked sessions and understand the underlying causes to resolve them before they impact performance. Keep an eye on the number of active sessions and pinpoint which sessions or queries are taking longer than expected. Analyze session behavior to detect slow queries and other activities that may be causing delays.

Optimize database performance by tracking buffer and statistics
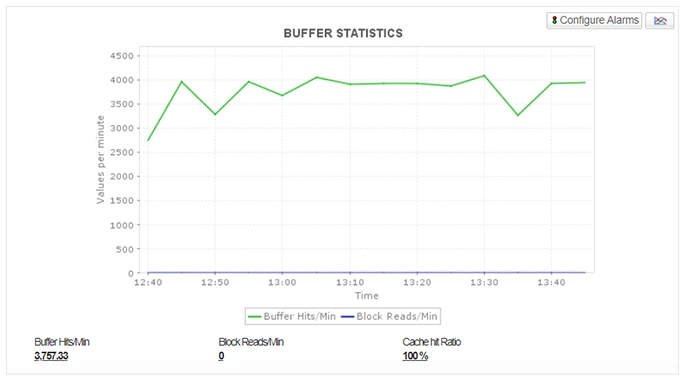
Gain insights into database performance by tracking critical buffer statistics.
- Cache Hit Ratio: Measure the efficiency of your database cache by calculating the ratio of cache hits to lookups. A higher percentage indicates better performance.
- Block Reads/Minute: Track the number of times data is read from disk. High values might indicate cache inefficiency or excessive data access.
- Buffer Reads/Minute: Monitor the overall cache utilization by tracking the number of cache hits per minute.


