Applications Manager's support for Prometheus integration auto-discovers Tomcat servers and Openshift monitors in your infrastructure and adds them as individual monitors in Applications Manager without any manual intervention! Get deep comprehensive insights into the performance of your Tomcat servers and Openshift monitors deployed in your Prometheus server without any hassle!
With Applications Manager's Prometheus integration, auto discover the scrape jobs from Prometheus server and categorize them to the respective monitor types in Applications Manager instantly!
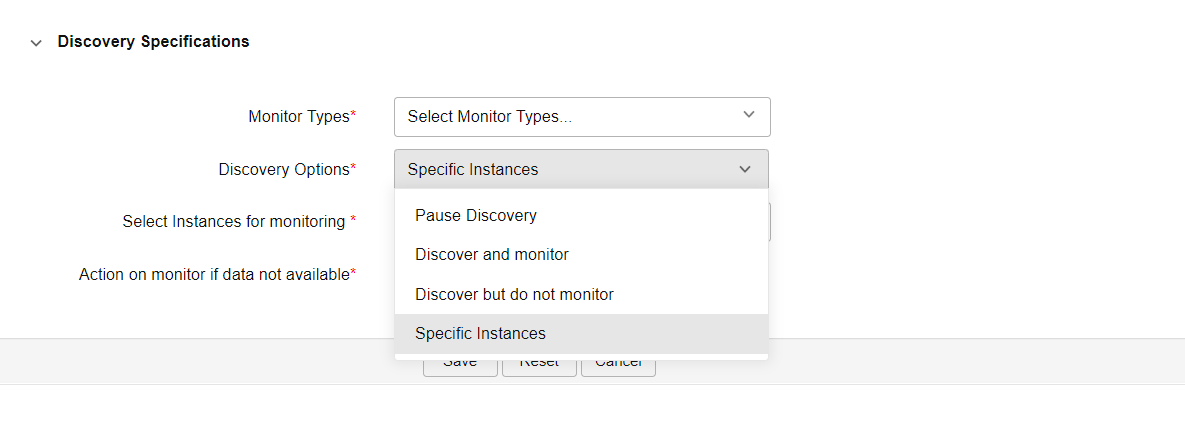
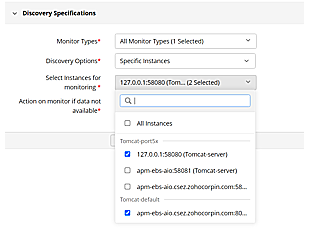
Choose how you want to configure the discovered Tomcat servers and Openshift monitors, and integrate Prometheus metrics. You can choose to stop with discovery, or further monitor them in Applications Manager to get critical metric data to help optimize server performance and prevent unplanned outages. Select the Specific Instances option to assign different discovery actions for different servers.


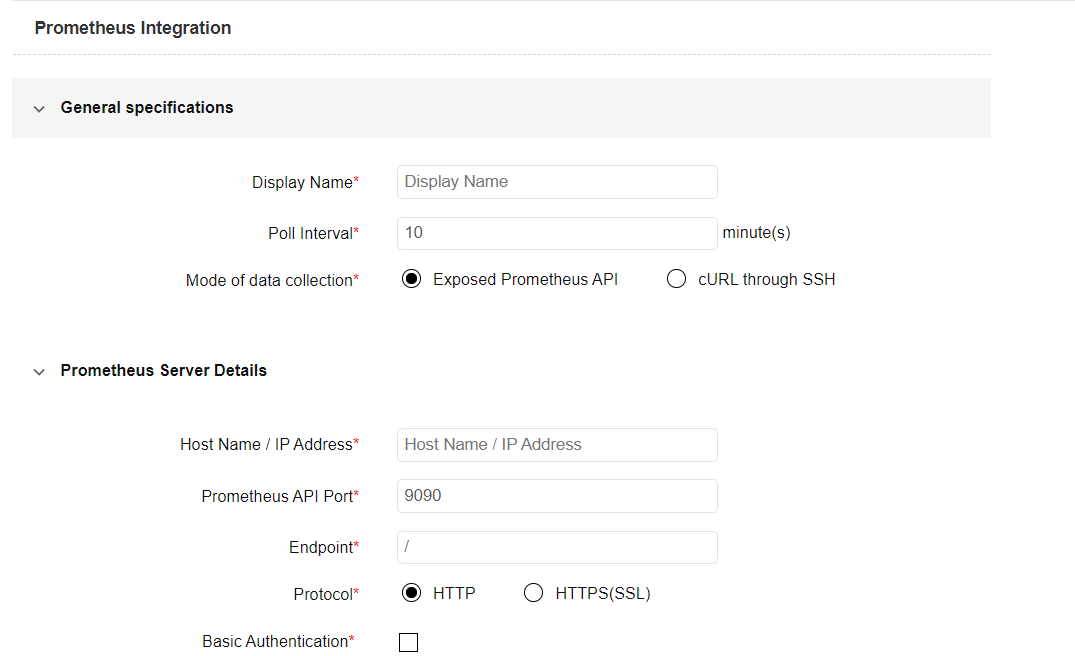
Prometheus monitoring can be configured and customized based on your requirements. You can choose from two types of data collection modes while adding a Prometheus server: Exposed Prometheus API and cURL through SSH.
The Expose API option allows Applications Manager to directly access the Prometheus URL to collect data for metrics and discovery of Tomcat and Openshift monitors. You can choose this option when your Prometheus URL is accessible throughout the network.
The SSH option allows Applications Manager to access the Prometheus URL only in the system in which Prometheus is deployed. This option is viable if you have deployed Prometheus as a pod in a container environment and are using Linux targets.
When setting up the Prometheus server, you can opt for your desired protocol for accessing API and also choose whether or not you want to use Basic Authentication option. The HTTPS option is recommended as it enforces secure communication of data transfers through RestAPIs. Applications Manager also has allowance for multiple Prometheus servers!
Once you discover your Tomcat servers and Openshift monitors through the Prometheus integration, you can track, monitor and visualize important server performance metrics all from a single dashboard. Analyzing performance statistics leads to a better understanding of how well your servers are performing. Prometheus integration can reveal pivotal information such as: server response time- to help you become aware of unusual latencies, the server performance- to give you an idea of the kind of load the server is handling, etc.
You can also configure reports for individual Prometheus metrics to analyze trends to understand the overall performance of your servers.These reports can be generated on demand, scheduled to be emailed, and can even be exported as pdf for later use.
With Applications Manager, configure thresholds for various performance attributes of Tomcat servers and Openshift monitors discovered via the Prometheus integration. Associate alarms for the same to get notified about threshold violations. Become aware of performance bottlenecks instantly and troubleshoot with ease! Ensure that you identify and troubleshooting errors before it interferes with the functioning of critical business critical processing running on them.

To view detailed steps on Prometheus integration with Applications Manager, click here.
It allows us to track crucial metrics such as response times, resource utilization, error rates, and transaction performance. The real-time monitoring alerts promptly notify us of any issues or anomalies, enabling us to take immediate action.
Reviewer Role: Research and Development
Trusted by over 6000+ businesses globally