IBM Db2 is a relational database that delivers advanced data management and analytics capabilities for transactional workloads, and runs on a wide range of platforms such as Linux, Unix and Windows (LUW). It is designed to deliver high performance, data reliability and availability, thus making it appropriate for a broad variety of enterprise and customer-facing applications.
Applications Manager provides comprehensive health and performance monitoring for your Db2 instances together with related applications and infrastructure elements. This helps you to maximize the efficiency and overall health of your Db2 database.
Identify root cause and fix costly performance issues with real-time visibility into key performance indicators such as availability, connections, cache hit ratio, transaction statistics, tablespace usage, database size, and other attributes of Db2 servers.
Optimizing your buffer pools will help you maximize the number of queries served from the cache. This is faster than reading data from the disk and minimizes the time your application spends reading data. Buffer pool hit ratios are one of the most basic metrics, and gives an overall measure of how effectively the system is exploiting memory to avoid disk I/O. Applications Manager's Db2 monitor can alert you when your buffer pool hit ratio value falls below the desired limit so you can take action before the application encounters performance problems.
If CPU or memory utilization reaches saturation levels, this can create a system bottleneck. With Applications Manager's Db2 monitoring software, you can regularly monitor system load on Unix, Linux and Windows systems by tracking CPU, memory and other information related to the system.
With the Db2 performance monitor, get transaction statistics from the to understand and track slow areas of performance in the database and rectify the issues before it leads to an outage.
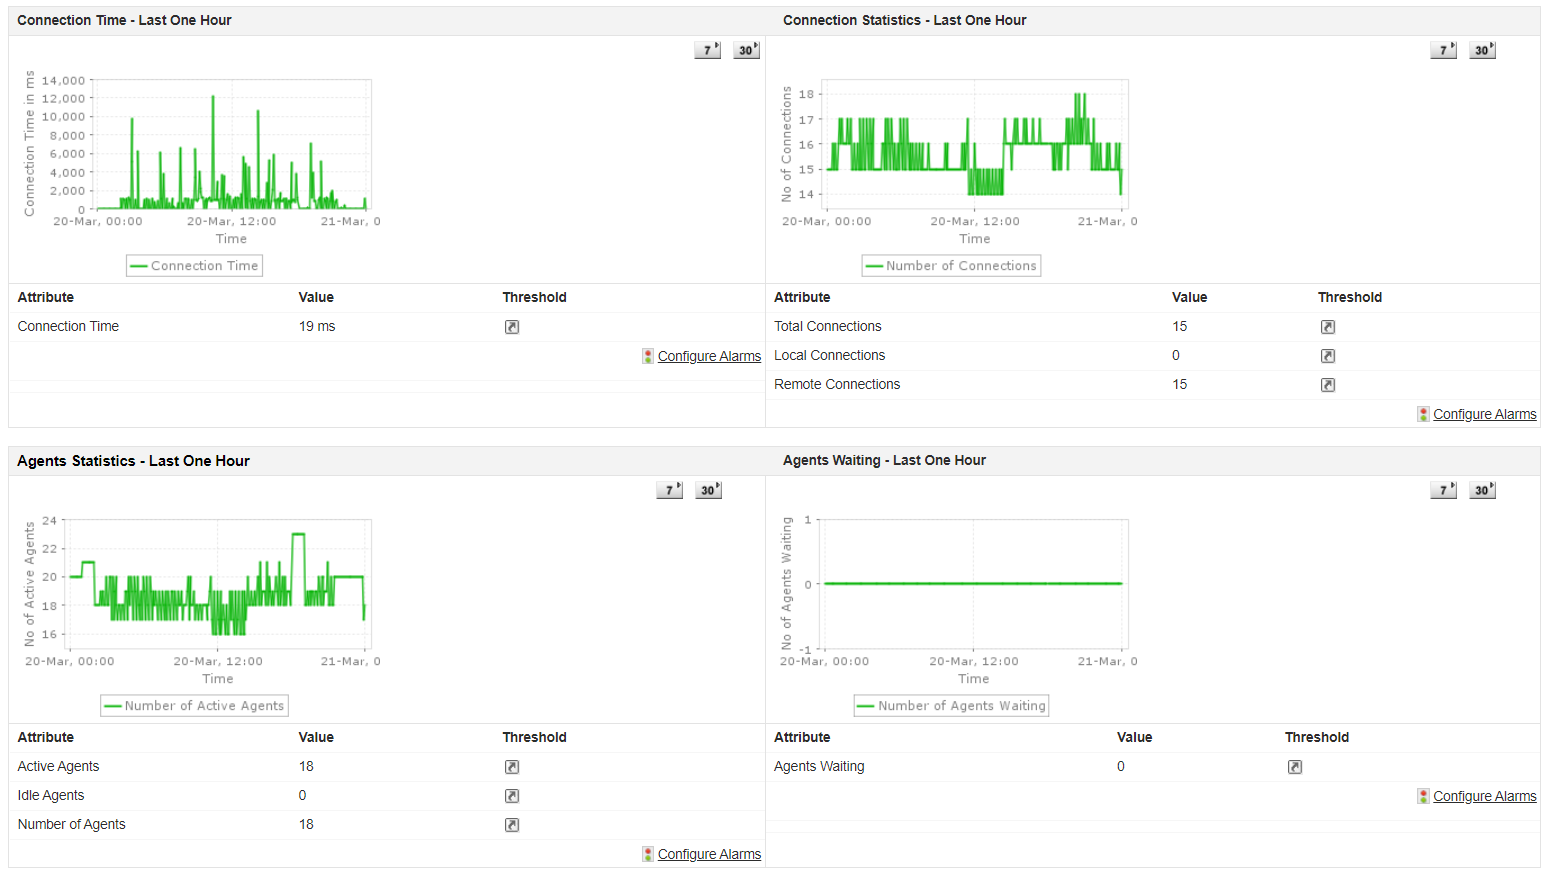
Applications Manager's IBM Db2 performance monitoring tool provides an understanding of your database connections precisely. It keeps a track of the connection time, total and remote connections, that helps discover the load on the database. It also collects details about agents like the number of agents waiting, and the number of agents registered in the current database.

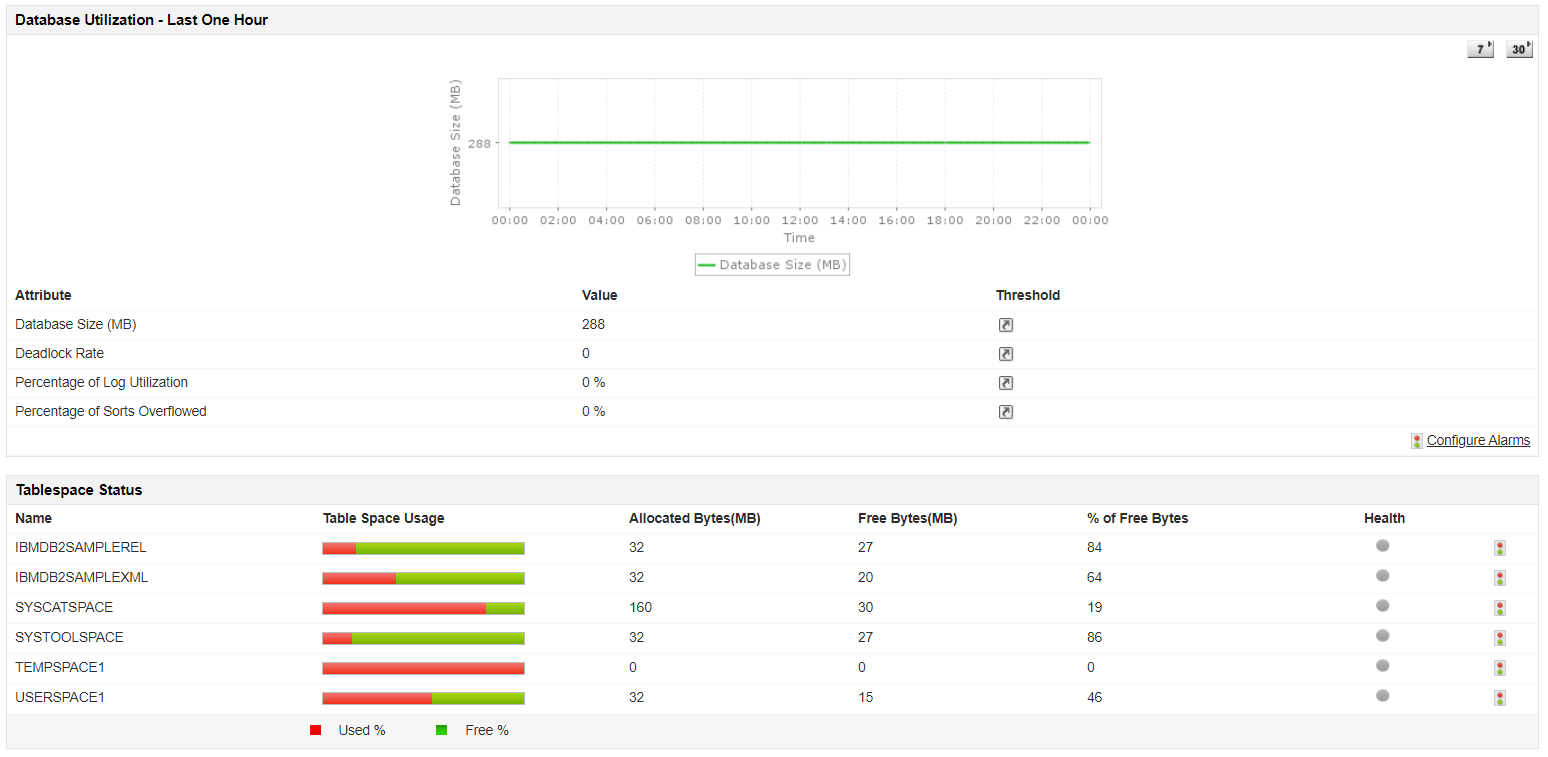
Applications Manager's IBM Db2 monitor enables you to optimize the performance of your database by keeping an eye on the deadlock rate. A deadlock is created when two applications lock data that is needed by the other, resulting in a situation in which neither application can continue to execute. With an efficient Db2 monitoring tool like Applications Manager, you can also track database size, the percentage of log utilization, sorts overflowed, tablespace statuses and their usage.

With Applications Manager's Db2 database performance monitor, keep track of the ratio of rows read to rows selected and know the average number of rows that are read from database tables. A high number can be indicative of sub optimal queries. You may then improve the efficiency of the queries by adding indexes.
You can set up Applications Manager to instantly notify you when it detects performance issues with Db2 servers. This enables you to take corrective actions faster and further tune the database performance.
You can configure Applications Manager's Db2 monitoring console to instantly notify you when it detects performance issues with Db2 servers. This enables you to take corrective actions faster and further tune the database performance.

If you are looking to monitor your Db2 database, just download a trial version of Applications Manager, set up the monitor, and start tracking the performance now!
It allows us to track crucial metrics such as response times, resource utilization, error rates, and transaction performance. The real-time monitoring alerts promptly notify us of any issues or anomalies, enabling us to take immediate action.
Reviewer Role: Research and Development
Trusted by over 6000+ businesses globally