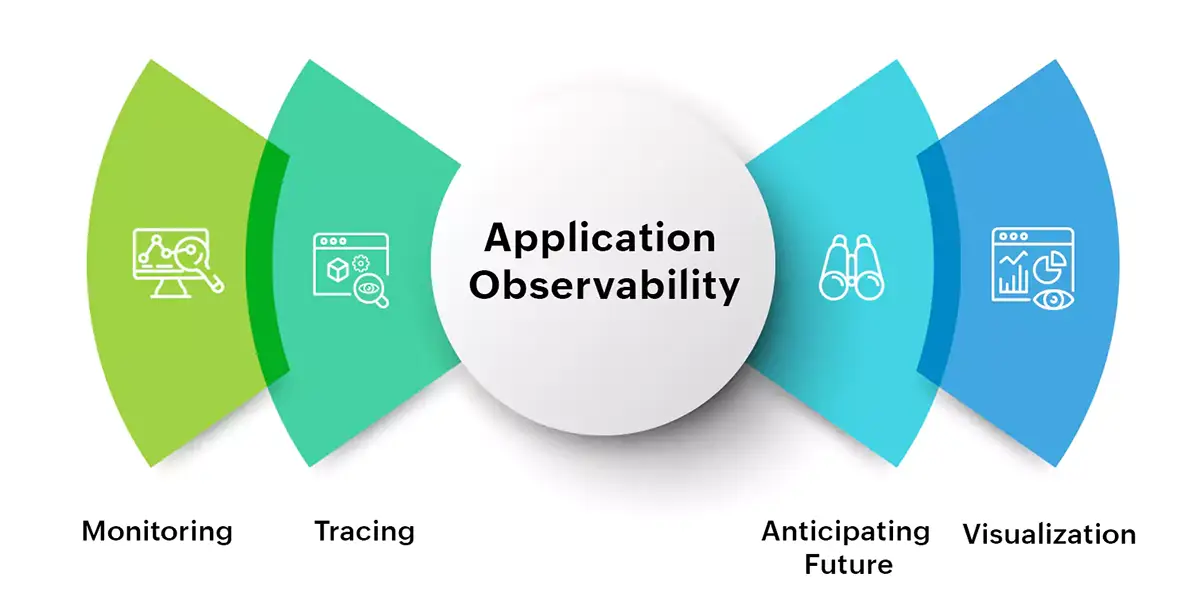
Application Observability
As the digital landscape continues to evolve, organizations have moved away from monolithic applications to complex cloud-native, distributed environments. The dynamic nature of these modern architectures has lead IT operations, DevOps, and Site Reliability Engineers (SRE) teams prioritize application observability to understand their environments better.
With development teams under increasing pressure to drive shorter development cycles, produce higher quality software, and innovate faster, they are looking for better methodologies to efficiently monitor, troubleshoot, and debug application performance issues. With application observability, teams can continuously discover and collect application performance telemetry by integrating with existing instrumentation built into application and infrastructure components, providing contextual insights into the what, where, and why of issues.
Application Monitoring and Observability

Observability and monitoring are often used interchangeably in the IT sphere. While they have a symbiotic relationship, they are not interchangeable. The difference between application monitoring and observability hinges upon the fact that monitoring provides visibility only into "known unknowns"-metrics you already know to watch out for. Observability gives details regarding conditions you didn't even know you had to look for.
Application performance monitoring (APM) tools typically focus on monitoring critical business transactions, infrastructure monitoring, delivering flawless user experience, and more. They provide contextual visibility into the availability, health, and performance of the entire application infrastructure, alert when the behavior deviates from normal, and deliver instantaneous feedback regarding system failures. For example, while monitoring a SQL server you might want to know about the best performing queries, slow queries, average response time, and more. Monitoring will help you spot patterns that can cause problems with respect to these critical application observability metrics.
However, application monitoring has its own limitations when it comes to diagnosing failures and issues in distributed architectures that have an array of dependencies. This is where application observability tools comes to play. It builds on APM data collection methods to better understand the internal state of the system and then monitor, troubleshoot, and deploy them. In short, application observability goes hand in hand with APM and creating an observable system is achieved as a part of implementing a robust application monitoring strategy.
Components of application observability
Typically, there are four components that help implement application observability:

- Instrumentation: Instrumentation uses agents to measure and track data that flows through the application. Instrumentation can aid in collecting telemetry data like metrics, events, logs, traces (MELT) from containers, services, application servers, and other components across the infrastructure.
- Data correlation: Understanding the data collected from various entities is critical to establish correlation between them. Analyzing data can also help discover any abnormalities in patterns.
- Incident response: Staying aware of outages will help application support and help desk teams to respond to incidents faster.
- AIOps: AIOps helps in improving the efficiency of your modern infrastructure by accelerating incident response. AIOps tools leverage machine learning models to automate critical application processes. Full-stack application observability data can be fed into these tools to eliminate false alarms, proactively detect issues, and accelerate mean time to resolution (MTTR).
Three pillars of application observability
For a system to be observable, it is important to know how to evaluate its state through its three main components-logs, metrics, and traces.
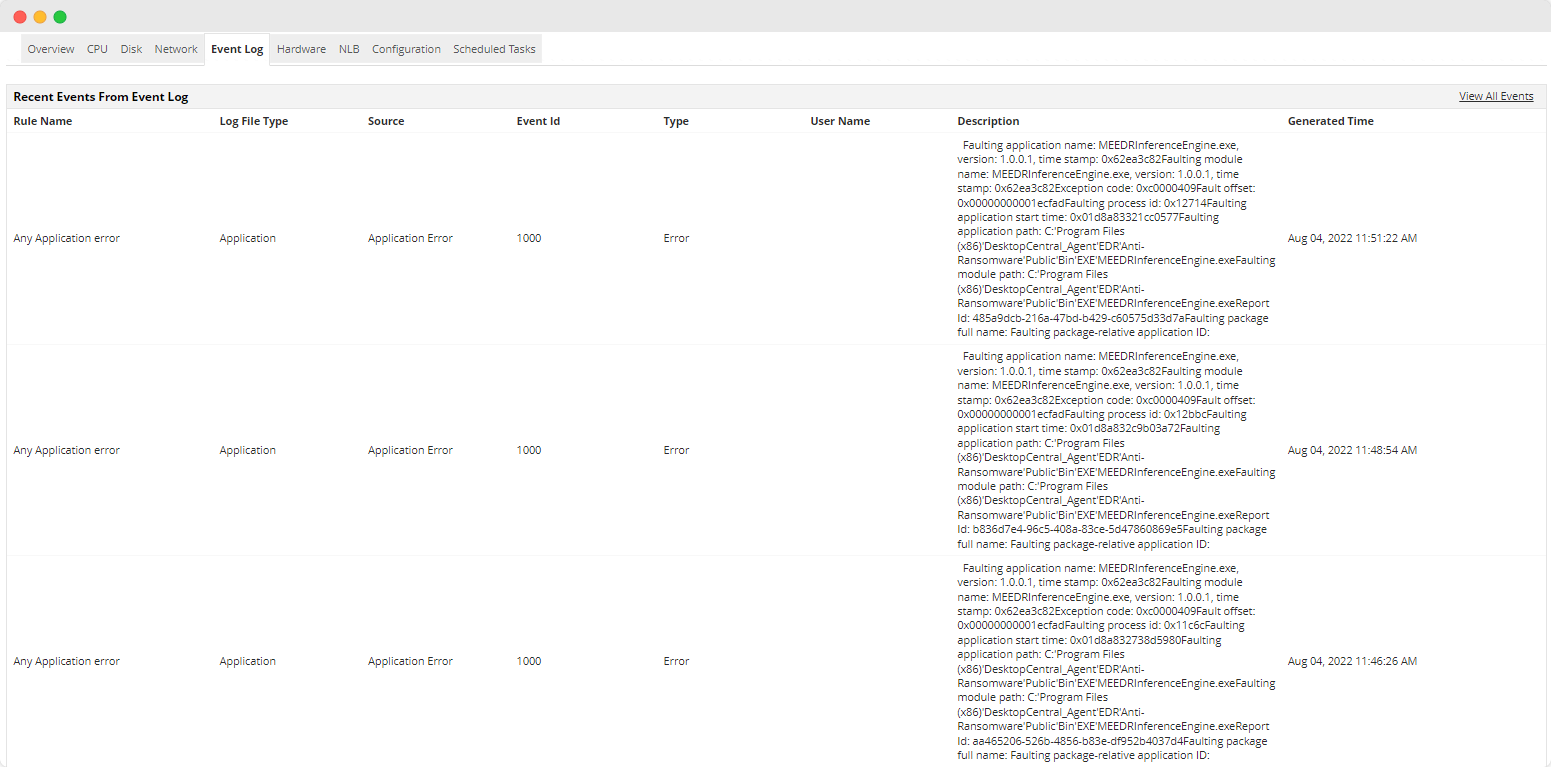
- Logs: Logs provide a detailed record of discrete events that may have occurred in the system at any point in time. Logs help uncover any suspicious or unpredictable behavior exhibited by components in your infrastructure. Every application generates a stream of log messages that contain sensitive and critical information about what, where, and when an incident occurred. Analyzing logs will help you easily drill down to the underlying cause of problems, understand why they occurred, what is causing them, and troubleshoot them.

- Metrics: There are three application observability metrics you need to measure
to understand the overall behavior of the system over time. They include:
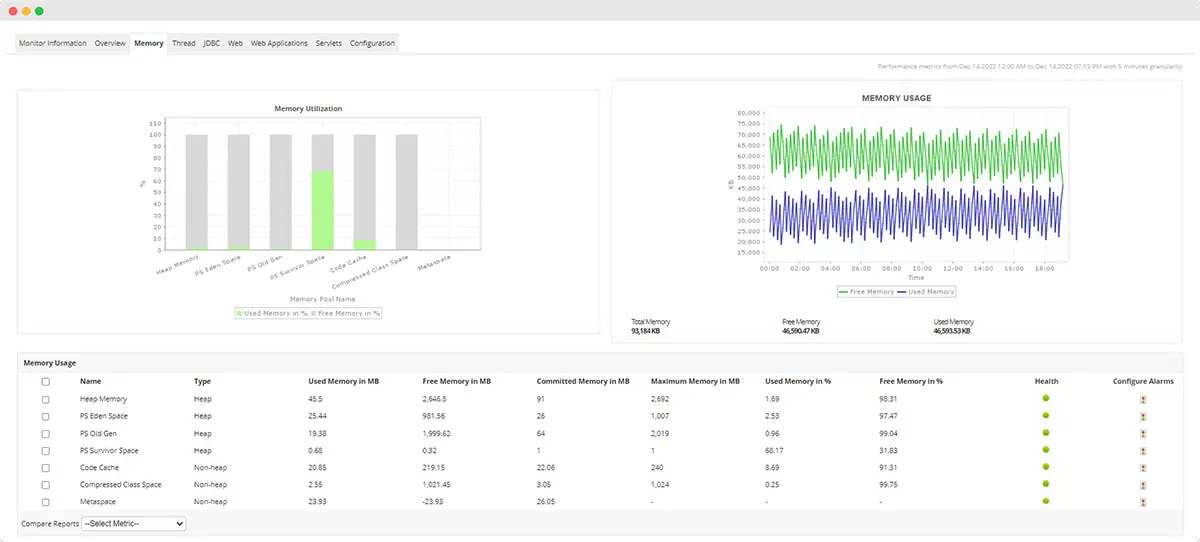
- Gauge Metrics: Gauge metrics represents data that has specific value at each point in time. For example: the CPU or memory utilization rate during the time of measurement.
- Delta Metrics: Delta metrics represent the number of occurrences within a specific time interval. They help capture the differences between the past and present state of the metrics. For example: the CPU temperature since the last time it was measured.
- Cumulative Metrics: Cumulative metrics represent the running count of occurrences. It captures the changes over a period. For example: the number of processes that have been called in the past hour.

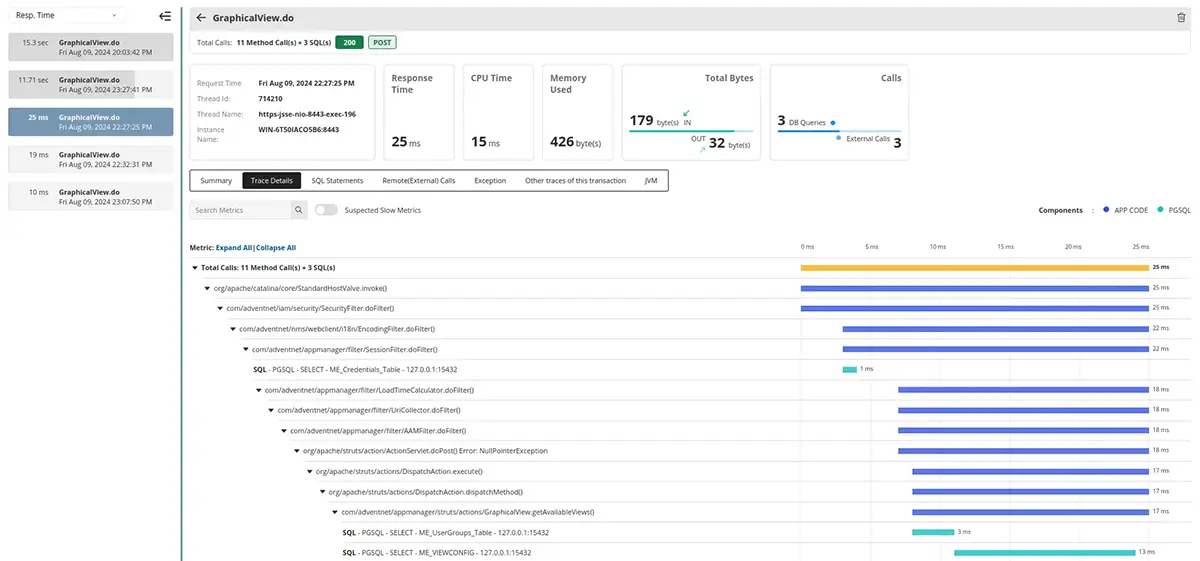
- Traces: Traces, the third pillar of observability, help understand the entire lifecycle of
requests or actions across several microservices, making them an essential component of microservices monitoring. They help identify the path and behavior of the requests
at various stages of the flow. Analyzing traces helps understand and measure the health of the overall health
of the system, pinpoint potential bottlenecks, and troubleshoot issues faster. However, traces provide a
special focus on the application layer alone, and they need to be visualized along with metrics to understand
the full story of your complex environment holistically. Traces help provide contextual insight into:
- The services or code that should be prioritized for optimization.
- The overall health and performance of services in your distributed infrastructure.
- Insight into the potential and current performance bottlenecks that could affect the end-user experience.

Application observability use cases:
- DevOps: Application observability aids DevOps continuous delivery principle by providing deep visibility into their entire application ecosystem and keeping track of planned or unplanned changes. Understanding the behavior of the system helps in predicting and preventing incidents, taking proactive decisions, thereby improving the quality and agility of DevOps practices. With better, wider, and accurate insights, observability helps strengthen the CI/CD pipeline.
- Site Reliability Engineers: Availability, performance, and resilience are three of the most critical site reliability metrics. These web application observability metrics will alert the SREs when their site is unreliable. Monitoring traces and logs will help understand the flow of requests through the applications while pinpointing bottleneck areas and tracking meaningful events in their services respectively.
- CloudOps: Observability offers a single source of insights into cloud services by correlating cloud performance metrics and health status to the state of your infrastructure. With a comprehensive view across one or more cloud environments, CloudOps teams are able to identify application issues, triage them, drill down to their root cause, and curate a better fault-tolerant cloud architecture.
Looking for an Application Performance Monitoring (APM) and observability solution?
Get started with ManageEngine Applications Manager by downloading a 30-day free trial to explore all the exclusive features on your own. You can also schedule a personalized demo, with our technical experts at the day and time most convenient for you!

