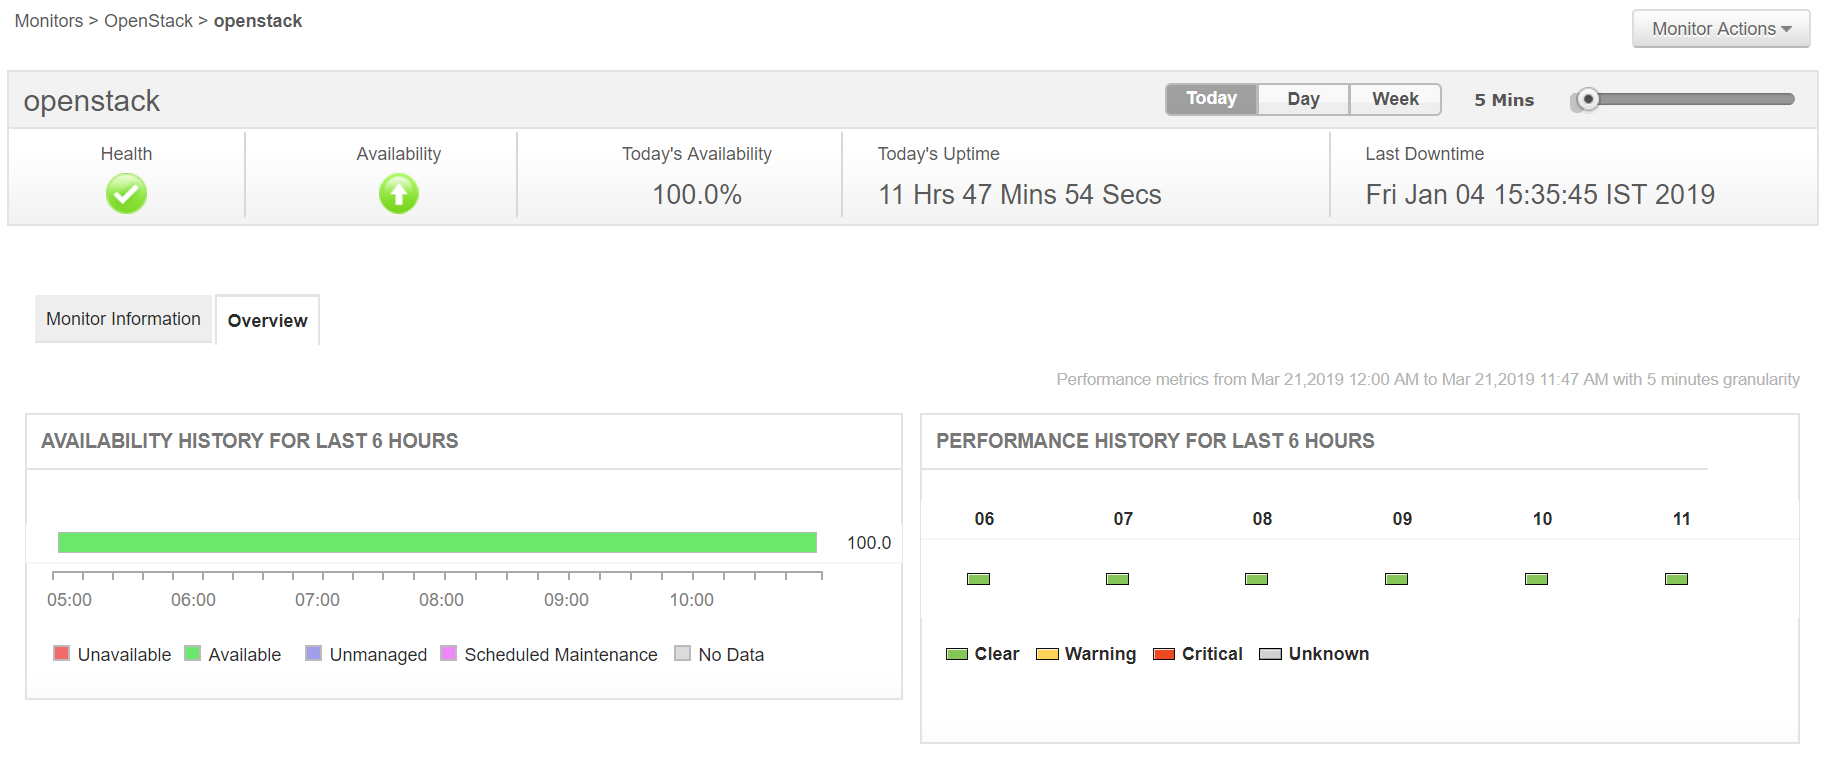
OpenStack is an Infrastructure as a Service (IaaS) platform, wherein virtual servers and other resources are made available to customers in their own business cloud infrastructure. Business that rely on OpenStack deployments for business-critical operations need a proper OpenStack monitoring tool that can monitor all the necessary performance parameters and raise red flags in case of downtimes.
OpenStack monitoring with Applications Manager allows administrators to monitor the performance and availability of their entire OpenStack environment. Keep an eye on all OpenStack instances and receive instant alerts about performance issues. Comprehensive monitoring, root cause analysis, and an advanced analytics module are just some of the features that make Applications Manager one of the most highly recommended OpenStack monitoring tools among IT admins worldwide.
With Applications Manager's OpenStack monitor, you can:
Monitoring OpenStack with Applications Manager ensures all the necessary information about your OpenStack deployment including its performance, health, and availability stats. Get instant alerts when there are problems with the performance of your OpenStack server and take timely corrective actions. Configure dynamic baselines to detect gradual performance degradation and make informed decisions regarding resource allocation and capacity planning.

Thousands of instances run under various images at an enterprise level in a cloud environment, highlighting the need for an OpenStack performance monitoring tool to monitor individual instance details. View the status of various instances whether they are active, paused, shutoff, etc., and configure individual alerts for each instance.

Applications Manager's OpenStack monitoring dashboard shows the details of all images in an OpenStack environment along with the images' statuses, sizes, and visibility. You can also view details of various disk format types being used by those images, and make sure all business-critical OpenStack metrics are available for easy access and analysis.

Get useful information about the stats of all the services running within the OpenStack architecture, such as the name of the service along with its type, endpoint URLs to access the service, and the current availability status of their components. The services that can be monitored include compute (Nova), identify service (Keystone), image service (Glance), networking (Neutron), as well as meta-services like Ceilometer, CloudKitty, etc. You can also enable, disable, or delete these services within the monitoring window from the Applications Manager console.

Applications Manager offers in depth monitoring for a wide range of business technologies, including OpenStack. It takes less than 5 minutes to set up; is very easy to navigate through; and offers comprehensive monitoring, alerting, and analytical capabilities, making a highly-preferred OpenStack management tool among IT admins. Download 30-day free-trial now!
It allows us to track crucial metrics such as response times, resource utilization, error rates, and transaction performance. The real-time monitoring alerts promptly notify us of any issues or anomalies, enabling us to take immediate action.
Reviewer Role: Research and Development
Trusted by over 6000+ businesses globally