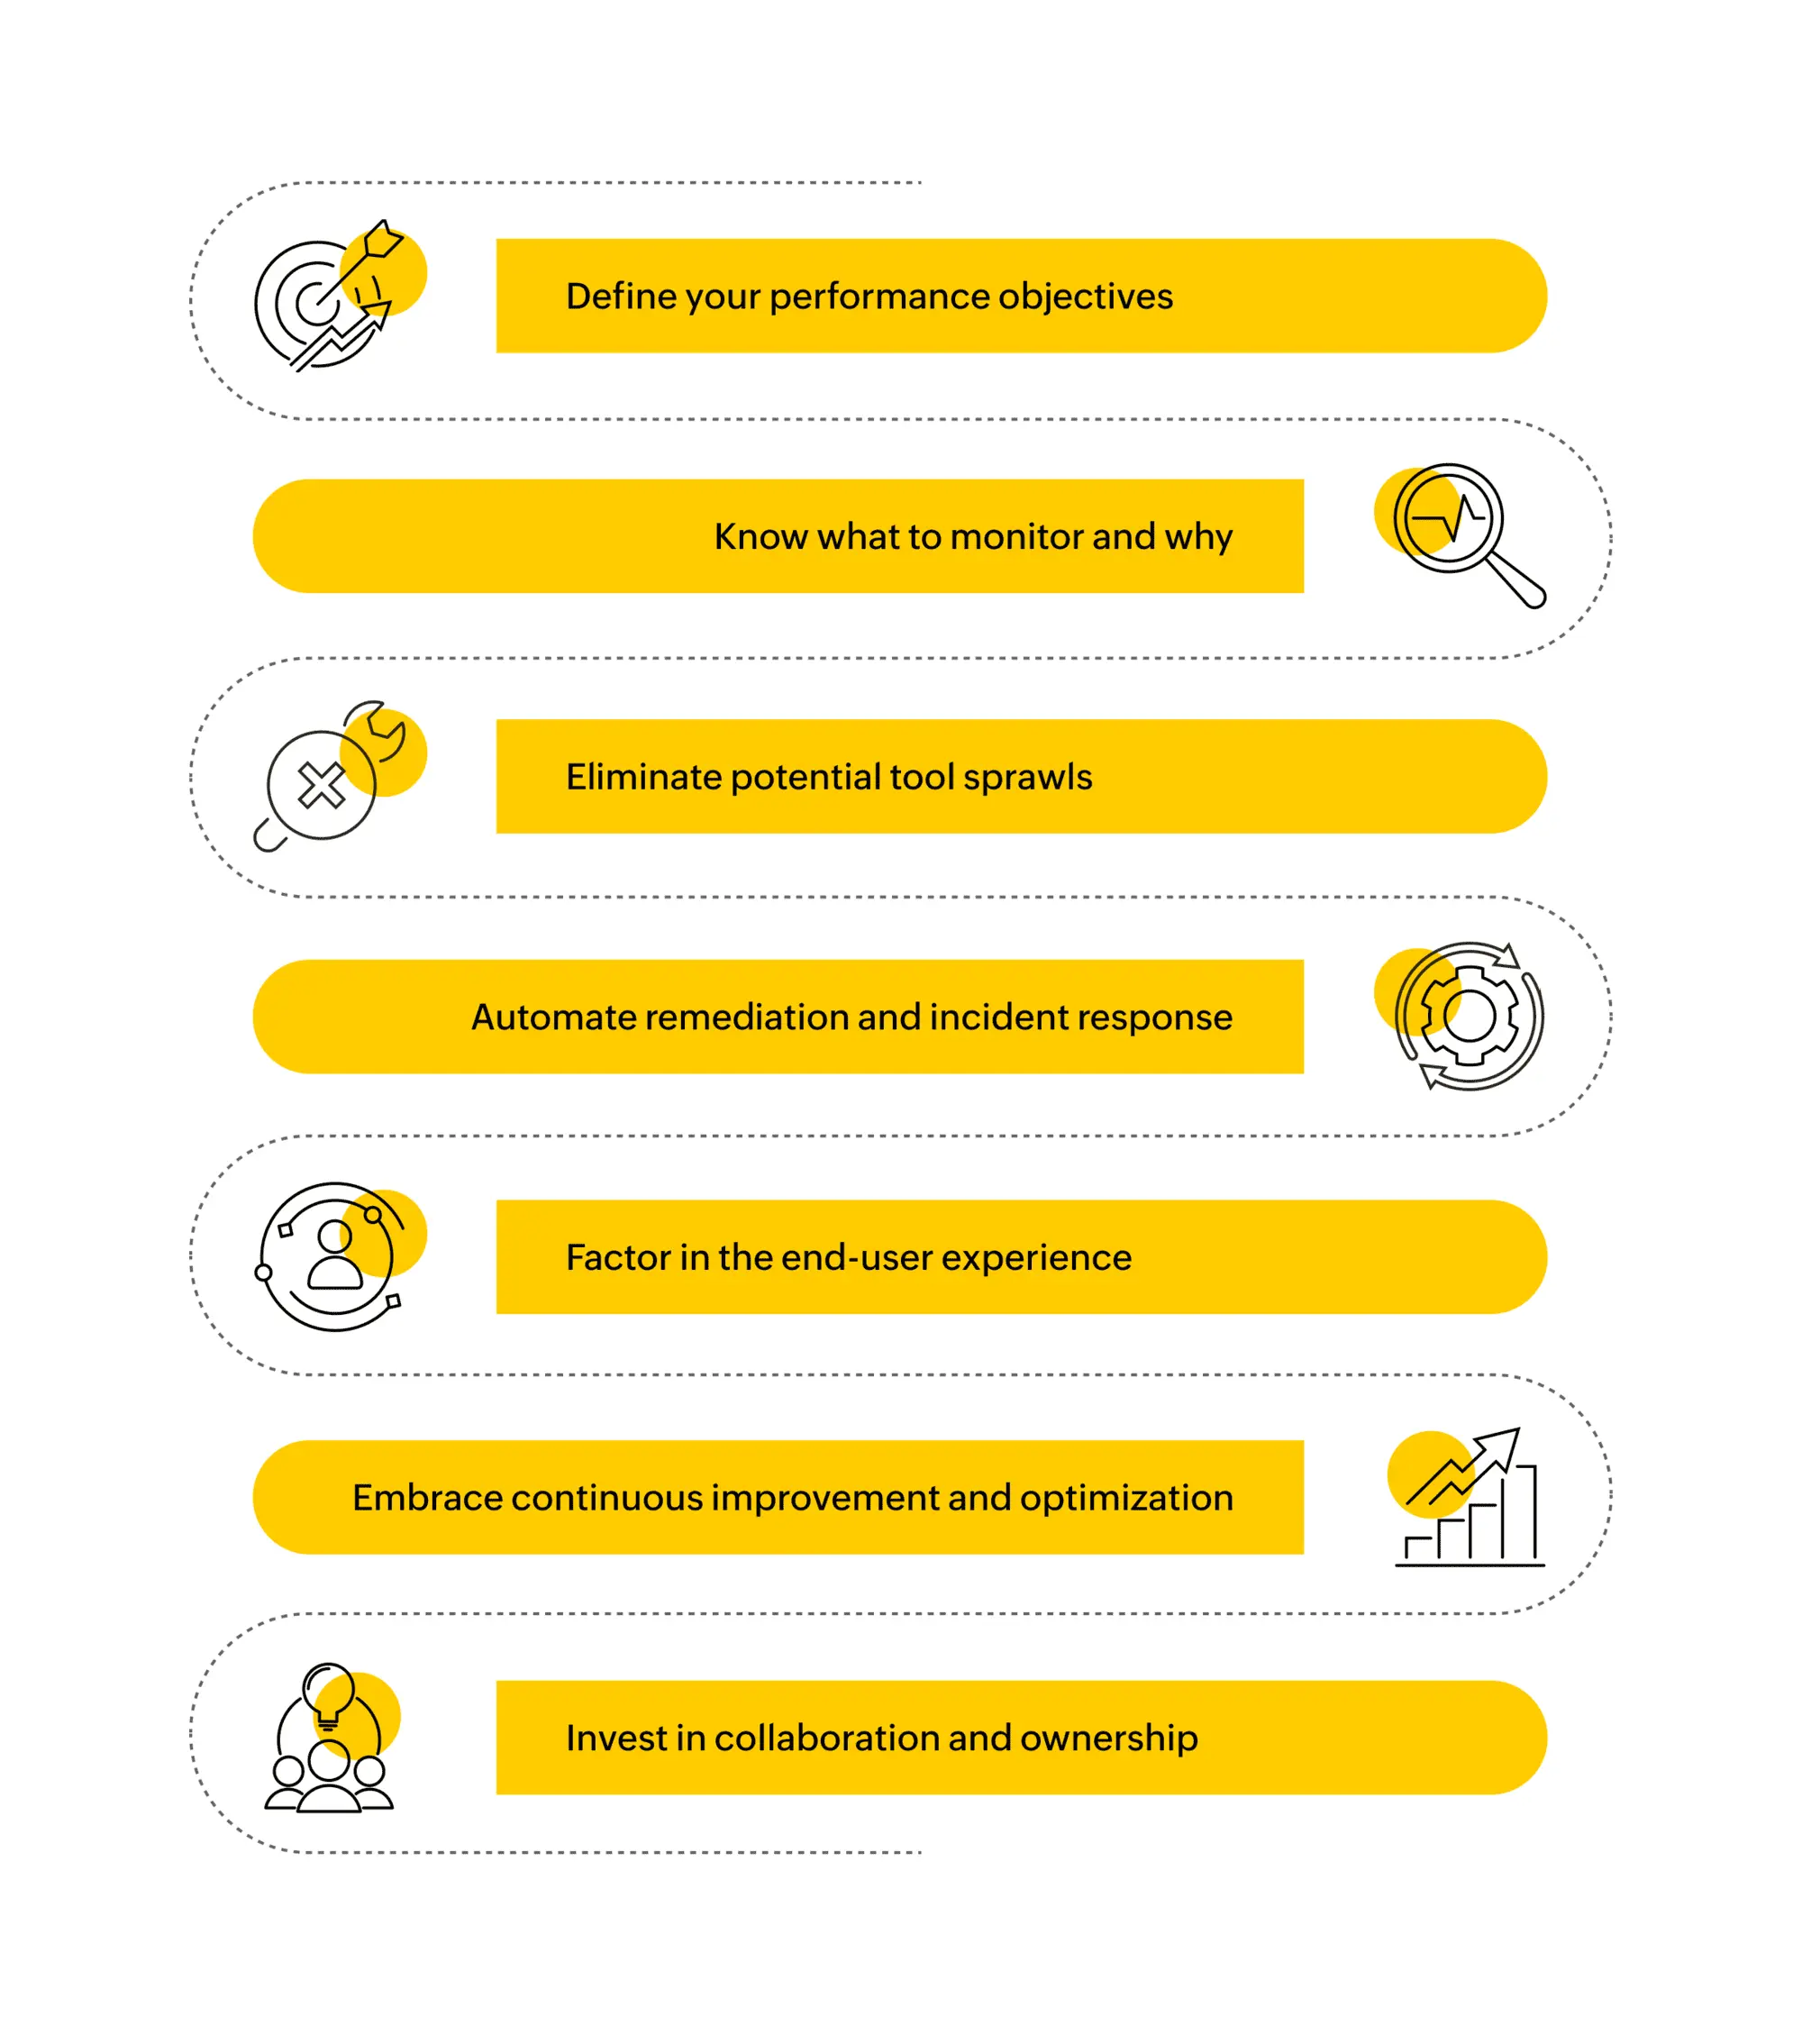
The significance of APM monitoring and observability cannot be overstated as technology continues to evolve and applications serve as the backbone of countless business operations. As organizations increasingly rely on digital solutions to drive their processes and engage with users, ensuring optimal performance and availability has become paramount. This goes beyond system uptime, delving into the intricate details of application behavior, response times, and resource utilization. A comprehensive approach is essential for identifying bottlenecks, optimizing user experiences, and proactively addressing issues before they impact end-users.
Let's take a look at seven application performance monitoring (APM) best practices that will transform your monitoring strategy from reactive problem-solving to proactive performance optimization, ensuring your applications deliver the user experience and business results that matter most:

It's crucial to define the "why" of your efforts before diving into the technical intricacies of monitoring. Align your performance objectives with clear, measurable goals that resonate with your business needs and user expectations. Are you aiming to boost conversion rates by 20% through faster page load times? Are you looking to automate the existing manual tasks by 35%? Striving to meet 99.9% of your SLAs? By establishing these quantifiable targets, you will be able to ensure your monitoring strategy focuses on data points that directly impact tangible outcomes, not just vanity metrics. Next, you need to establish a baseline for application behavior, leveraging MELT (metrics, events, logs, traces) data. This involves comprehensively understanding the normal operational parameters of an application under typical conditions. By meticulously analyzing and documenting key performance metrics during periods of stable and expected activity, organizations can create a baseline that serves as a reference point for detecting anomalies.
When it comes to application performance monitoring, there are a wide variety of metrics you need to be aware of. Here are some of the most important metrics that you need to keep an eye on:
Diverse teams, each with unique responsibilities, often employ a multitude of tools to cater to their specific needs. For instance, DevOps teams focus on streamlining and automating the development cycle. While site reliability engineers (SREs) concentrate on ensuring the reliability of applications, services in production environments, and optimal website performance. While each tool serves a purpose for individual teams, the proliferation of different tools hampers overall visibility and complicates issue resolution. In this context, interoperability becomes a non-negotiable capability in an APM tool. While it may be impractical to replace 50 tools in an organization at once, an effective APM solution should offer sufficient capabilities to replace at least a subset and seamlessly integrate with the others. Eliminating tool sprawl emerges as one of the application performance monitoring best practices, adding substantial value by consolidating insights, reducing complexities, and fostering a more streamlined and efficient monitoring process.
When major incidents occur, manual troubleshooting can be counterproductive. This is exactly where automation comes in handy. It is crucial for organizations to identify specific scenarios and events that warrant automation, such as resource scaling during traffic spikes or restarting services upon failure. Defining these objectives will ensure that automation efforts align with organizational goals and priorities. To maximize the benefits of automation, you should follow these steps:
The end-user experience isn't just a bonus in application performance monitoring—it's a fundamental pillar. No matter how stellar your server response times or CPU utilization rates are, if users click away due to poor digital experience, all the technical stats means nothing. You need to be able to understand user behavior, preferences, and potential pain points in real time, track their journeys across geographies, and understand where the bottlenecks lie. Imagine your "Apdex" score dropping from a good 0.85 to a not-so-good 0.65 – that's a sign something's off. With a robust end-user experience strategy in place, you will be able to understand if this issue is because of a slow load time after deploying a new feature or concurrent user sessions. Here are three best practices you can follow:
Business applications, much like the businesses they support, must undergo constant evolution to navigate new challenges effectively and capitalize on emerging opportunities. Engaging in the continual upgrade and optimization of both applications and their underlying infrastructure and services becomes paramount to staying agile and responsive. Application monitoring is not a one-time task, but an ongoing process that demands adaptability and customization. Some of the best practices in application performance monitoring include:
Effective APM doesn't solely reside in the IT department. It is imperative to foster a culture of collaboration where developers, operations, and business stakeholders share responsibility for application performance management. Setting up unified dashboards will help you consolidate data from various sources providing a single, comprehensive view of application performance metrics. This not only enhances visibility but also streamlines issue resolution by enabling cross-functional teams to identify and address performance bottlenecks collectively.
ManageEngine Applications Manager provides deep application performance monitoring, infrastructure monitoring, and digital experience monitoring—all from a single console. With our comprehensive application performance monitoring solution, you will be able to gain unparalleled insight into the performance of your applications, whether on-premise or in the cloud. Furthermore, you will be able to diagnose issues, drill down to their root cause, automate actions, and deliver flawless user experiences. Curious to know more? Schedule a personalized demo or take a 30-day free trial today!
It allows us to track crucial metrics such as response times, resource utilization, error rates, and transaction performance. The real-time monitoring alerts promptly notify us of any issues or anomalies, enabling us to take immediate action.
Reviewer Role: Research and Development
Trusted by over 6000+ businesses globally