Detecting performance problems that creep up over a period of time is quite difficult with the current fault management setup that works very well for day-to-day problems such as a sudden spike in CPU Utilization, server outages, etc. It is imperative that gradual performance problems are quickly identified and fixed before it can impact your customer.
For example, if the load on the server increases over a period of time, the response time will gradually be affected and the customer would be frustrated. Anomaly detection in Applications Manager can be the key to detect performance problems like the ones mentioned above.
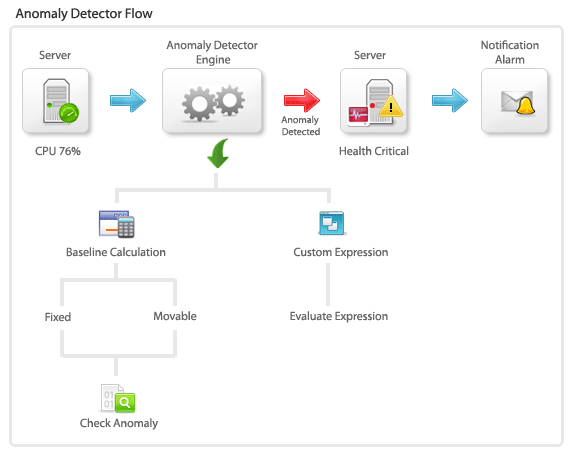
Anomaly detection helps you know if there is a gradual performance degradation by defining anomaly profiles on performance metrics. By creating anomaly profiles, you can define rules wherein the current data is compared with the previously reported best data (say some six months back when the system was working at optimum level).

Anomaly profiles can be created based on:
Anomaly happens when the current set of values do not conform to the baseline range values. The current Attribute values are compared against the reported data in a particular week [fixed value] or with simply the previous week's data [moving value]. After choosing the week for baseline comparison, each day's value will be compared with the corresponding day of the baseline week. For example, if you choose week 1 of August as baseline week, then every Monday's data will be compared with the value of the Monday of August 1st week.
Anomaly is detected when current data doesn't conform to the user-defined rules [based on system variables]. For example, the user can create a rule such as Anomaly is to be detected when the current Last Hour Average Value is greater than twice the Six Hours Moving Average Value. Critical and Warning alarms can be set accordingly.
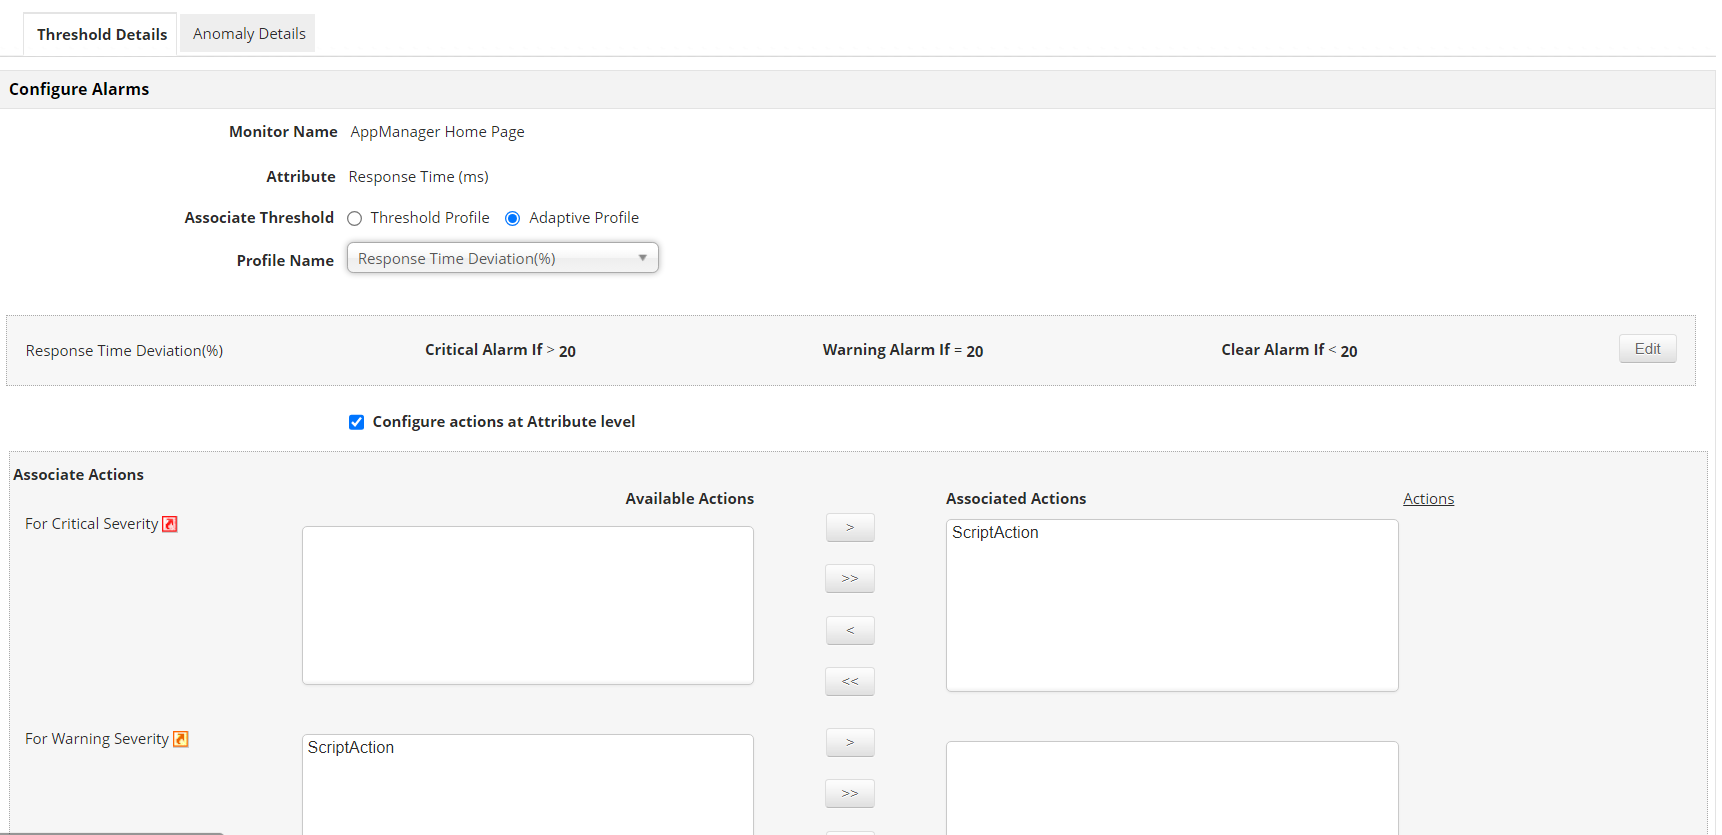
Anomaly profiles that are created should be associated with the concerned performance attributes. Suitable Alarm actions like EMail are also associated. For example, if anomaly is detected with response time of the server, an EMail notification will be sent to the admin to troubleshoot the problem.
Anomaly profiles need to be created and associated at the individual monitor level, as they cannot be configured through Monitor Group templates or Type templates.
Anomaly Dashboard: The performance of the monitors can be viewed from Anomaly Dashboards. It helps in troubleshooting too.
You can also automate detection of anomalies by leveraging Machine Learning techniques. This helps avoid human errors as the threshold we set may not be accurate in identifying all types of anomalies.

Applications Manager uses the RCPA algorithm to use historical data of the attribute to train a model using machine learning. After the model is generated, the collected data is queried with the model to identify if there are abnormal values.
If an abnormal value is determined, alerts are generated and are displayed as RCA messages. If the collected value has deviated the trained value by a greater percentage, a critical alert is generated. If the collected value does not have any anomaly, then the clear alarm is raised.

Get notified through email, SMS or Slack messages or automatically raise tickets in ITSM tools such as ServiceNow and ServiceDesk Plus. Automate corrective actions when an anomaly is detected and reduce the mean time taken to repair.
It allows us to track crucial metrics such as response times, resource utilization, error rates, and transaction performance. The real-time monitoring alerts promptly notify us of any issues or anomalies, enabling us to take immediate action.
Reviewer Role: Research and Development
Trusted by over 6000+ businesses globally