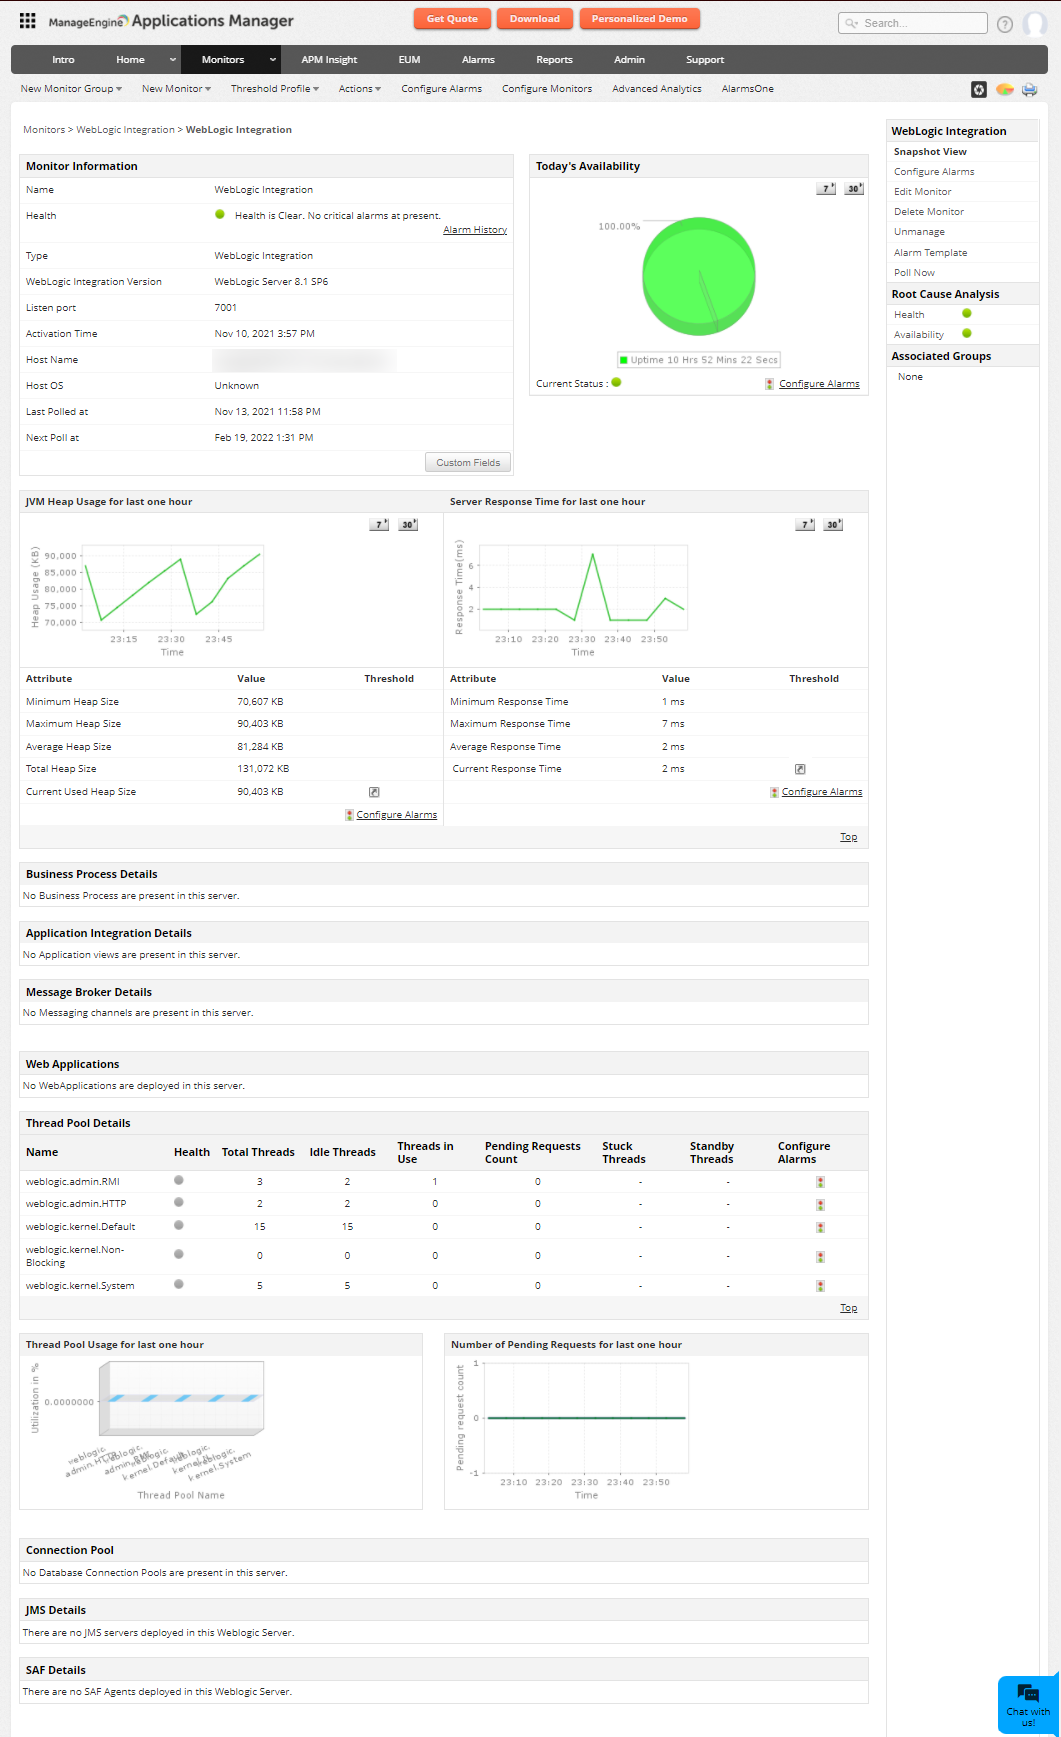
Applications Manager monitors the performance and availability of BEA WebLogic Integration Servers.
Applications Manager automatically diagnoses, notifies, and corrects performance and availability problems not only with WebLogic Integration Servers, but also with the servers and applications in the entire IT infrastructure.

WebLogic Integration Monitoring includes the following version of WebLogic Integration Server.
"We, at Hughes Network Systems are very pleased with the AppManager product. We looked at a number of other Application Management products, and they were all very expensive. Your product, allowed us to manage our WebLogic layer of our PeopleSoft application, at a reasonable cost. Support has been very responsive, and you have added a number of features that we have requested (Polls to retry can be configured individually for any attribute of a Monitor and Multiple varbind support in alarm messages)"
Anthony MyersWebLogic Integration Server monitoring includes delivering comprehensive fault management and proactive alarm notifications, checking for impending problems, triggering appropriate actions and gathering performance data for planning, analysis, and reporting.
Some of the components that can be monitored in WebLogic Integration Servers are:
Applications Manager offers a 30-day free trial where you can monitor WebLogic integrations servers and understand how it may be the ideal product for your organization's WebLogic monitoring needs. It is easy to setup and configure. Download now!
It allows us to track crucial metrics such as response times, resource utilization, error rates, and transaction performance. The real-time monitoring alerts promptly notify us of any issues or anomalies, enabling us to take immediate action.
Reviewer Role: Research and Development
Trusted by over 6000+ businesses globally