Applications Manager's Oracle WebLogic monitoring tracks and collects key WebLogic performance metrics such as JVM Heap Usage, Server Response Time, User Sessions, Thread Pools, JDBC connection pools, Messaging services, and EJB statistics. Applications Manager leads as one of the foremost Oracle WebLogic monitoring tools in the industry that helps you to keep an eye on your most critical applications and improve their performance. Applications Manager's proactive alerts provides an early warning of performance issues and enables you to take corrective measures before end users are affected.
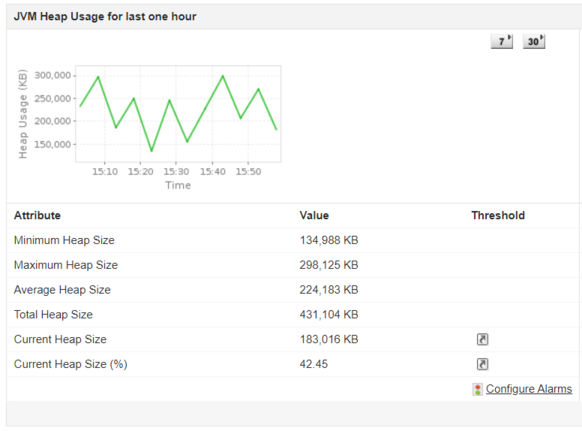
An increasing value of heap size may indicate a memory overflow. Detecting this can prevent the server from crashing or slowing down. Applications Manager's Oracle WebLogic monitoring provides visibility into JVM performance and helps you detect out-of-memory exceptions occurring during application execution, memory leaks as well as insights into garbage collection and thread pool usage.

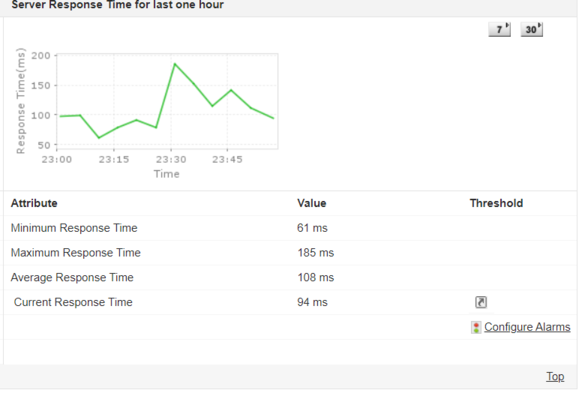
Server response time is an important metric as it indicates the time the server takes to respond to a user request. Monitoring this metric is one of the best ways to identify if the server is functioning efficiently. If this value appears to increase at a rapid pace, you may need to analyze the load on your server.

With Applications Manager's WebLogic performance monitoring capabilities, get extensive user session details like number of active sessions, maximum number of sessions, total number of sessions and number of servlets. Become aware of the request load on your server and identify if sufficient servlets exist to handle the requests received.
The thread pool allocates threads to process the requests of service servers and client servers. WebLogic server monitoring tools like Applications Manager can help keep track of various threads in the WebLogic server:
Furthermore, get insights about messaging services such as JMS(Java Message Service) and SAF(Conversations and endpoints) to understand why messages fail to get delivered. Manage message persistence by analyzing and configuring greater quotas for SAF agents that are being overloaded.
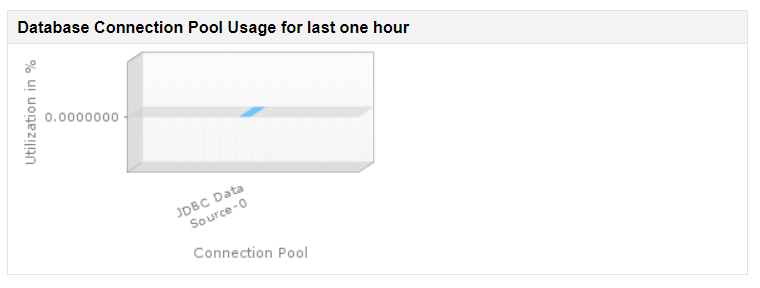
Database access can sometimes create performance issues for Java applications, so it is important to monitor JDBC connection pools. Use Applications Manager's WebLogic monitor to track the health and utilization of the database connection pool - how many active connections, how close is the connection pool to using the max connections allocated to it, and threads waiting for connection. If the active connections are reaching the highest number of connections possible in the pool, you should increase the upper limit for the connection pool. You can also track the number of leaked connections to understand potential issues in the application logic.

With Applications Manager's WebLogic application performance monitoring tool, track your EJBs- it's type, activation, passivation, and the number of threads waiting. The EJB container performs passivation when the cache becomes full. When the EJB session object is needed again, the Bean is activated by the container. An increased number of Passivation state indicates the cache becoming full frequently. Keep an eye on the state of the beans and become aware of the transactions taking place in the server. Identify abnormal pool-miss ratio and resolve it before it overwhelms the server.
A managed bean (MBean) is a Java bean that provides a Java Management Extension (JMX) interface. Applications Manager queries MBeans and sends out notifications in case of faults to ensure there's no degradation in application performance. Gain real-time visibility into custom metrics in your application deployment like the state of memory management, class loading, active threads, logging, and platform configuration.
Applications Manager serves as an intelligent WebLogic monitoring tool with a dynamic reporting feature that supports both numerical and graphical representations of key attributes. You can monitor WebLogic server performance and make learned decisions regarding your server using trend analysis, forecast and inventory reports!
Use Applications Manager to monitor the Java applications running on WebLogic, providing you with visibility from the browser all the way down to the individual database statements. Attain deep code-level visibility and pinpoint the root cause of application issues in production.
Understand the impact of server performance on WebLogic by monitoring server hardware, processes and services, resource utilization and forecasting, and disk volumes. You can also monitor 130+ infrastructure types with Applications Manager - including on-premise technologies such as application servers, databases, middleware, VMs, web services as well as cloud resources.
Applications Manager offers a 30-day free trial where you can start monitoring WebLogic components and explore all the features within our WebLogic monitoring dashboard to understand how it can help you with your business needs. It is easy to setup and configure. Download now!
It allows us to track crucial metrics such as response times, resource utilization, error rates, and transaction performance. The real-time monitoring alerts promptly notify us of any issues or anomalies, enabling us to take immediate action.
Reviewer Role: Research and Development
Trusted by over 6000+ businesses globally