Neo4j, one of the most popular databases, is a graph database management system which is ACID-compliant. As with any database, Neo4j is also a core component in any system and requires constant monitoring. Monitoring Neo4j is made easy with Applications Manager's capability for Neo4j monitoring which provides valuable insights into key Neo4j metrics, and notifies of areas that need attention, enabling you to optimize performance of Neo4j servers.
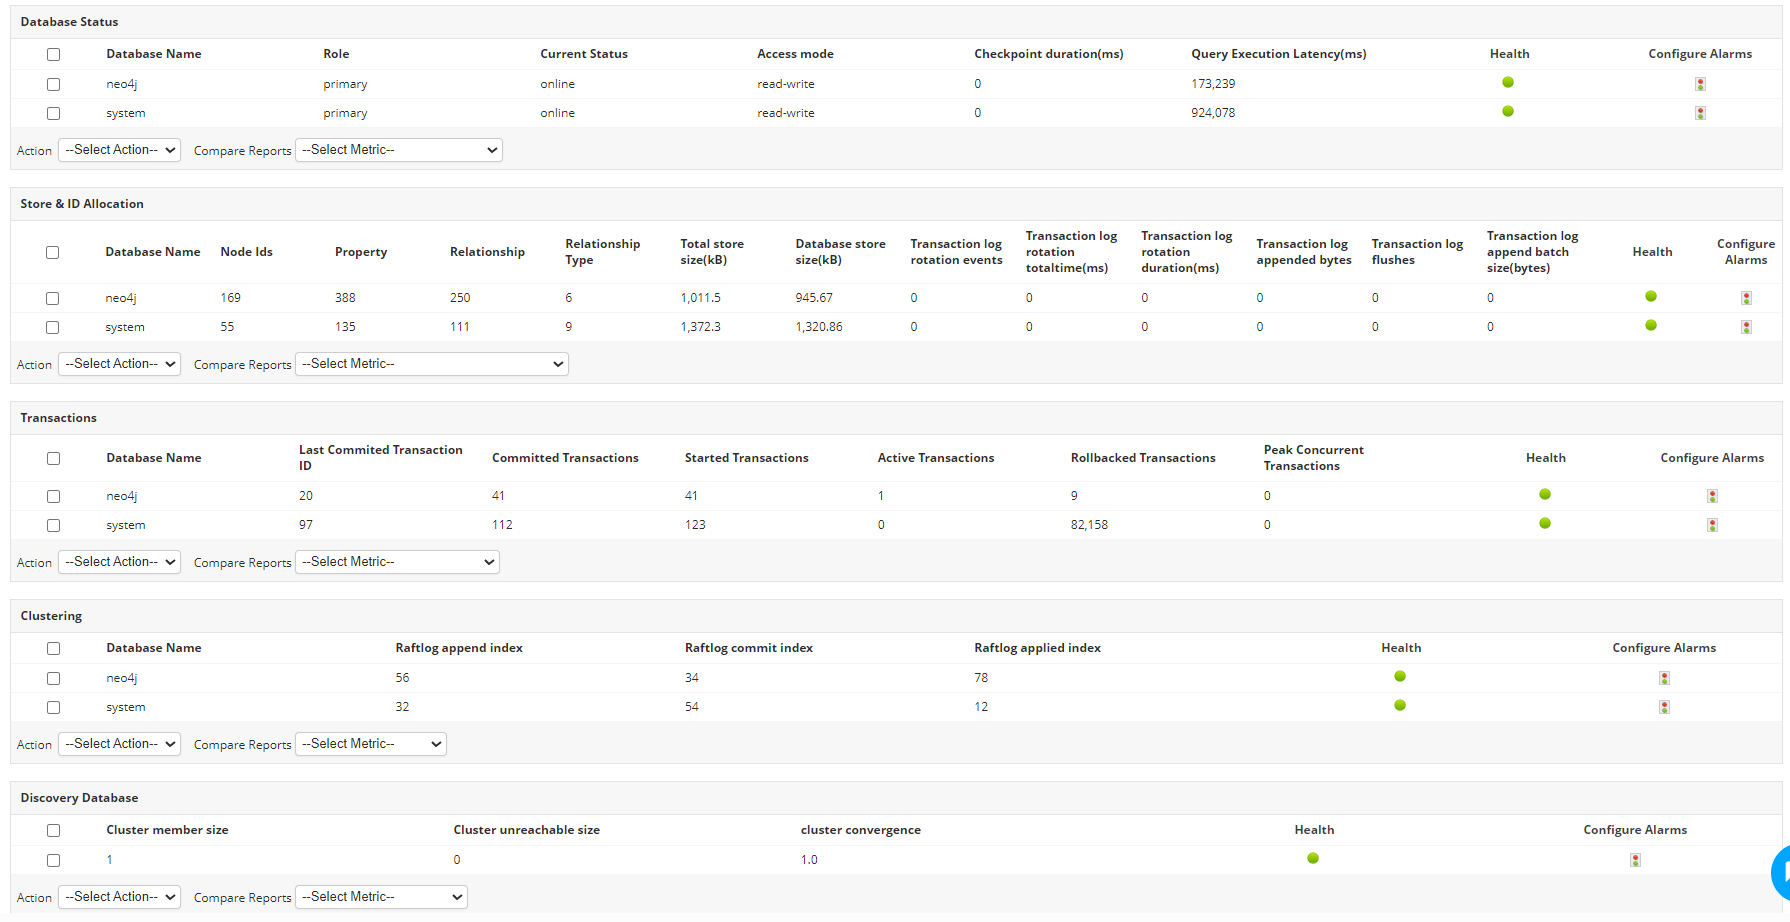
Applications Manager enables you to perform thorough Neo4j monitoring by providing essential details about your database like memory, cluster, nodes, threads and many more while presenting them in an operational dashboard, for easy grasp of information.
Memory management is crucial when it comes to databases. Applications Manager's Neo4j monitoring tool gives prominence to resource breakup and utilization of Neo4j database, providing details about Physical, Virtual and Swap memory usage. It also gives extensive Heap/Non-Heap memory breakdown data. Perform concurrent operations smoothly by optimizing the Heap Memory and Non-Heap Memory usage in Neo4j.

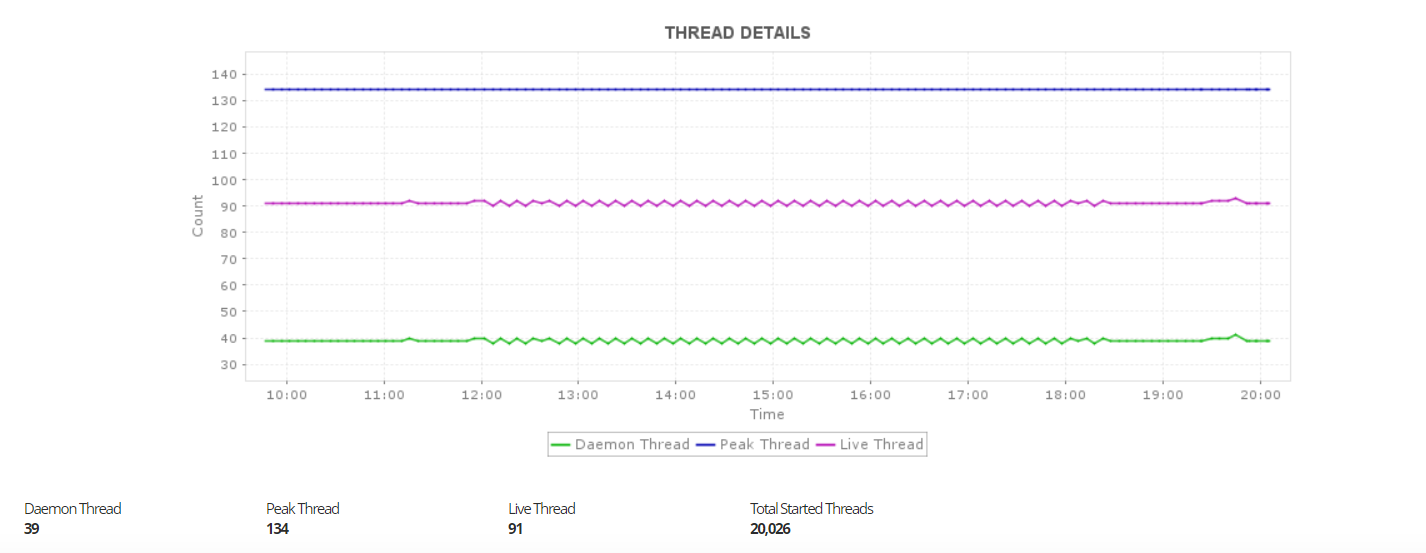
Applications Manager's Neo4j management tool sheds light on thread operations in the server. It gives the count of total threads running, daemon threads, peak threads and live threads. Reduce the response time of database queries by identifying the threads that take up time and prioritizing them.

With Applications Manager's Neo4j monitor, you can obtain in-depth visibility into the performance of your Neo4j databases by enabling you to monitor the following key parameters:

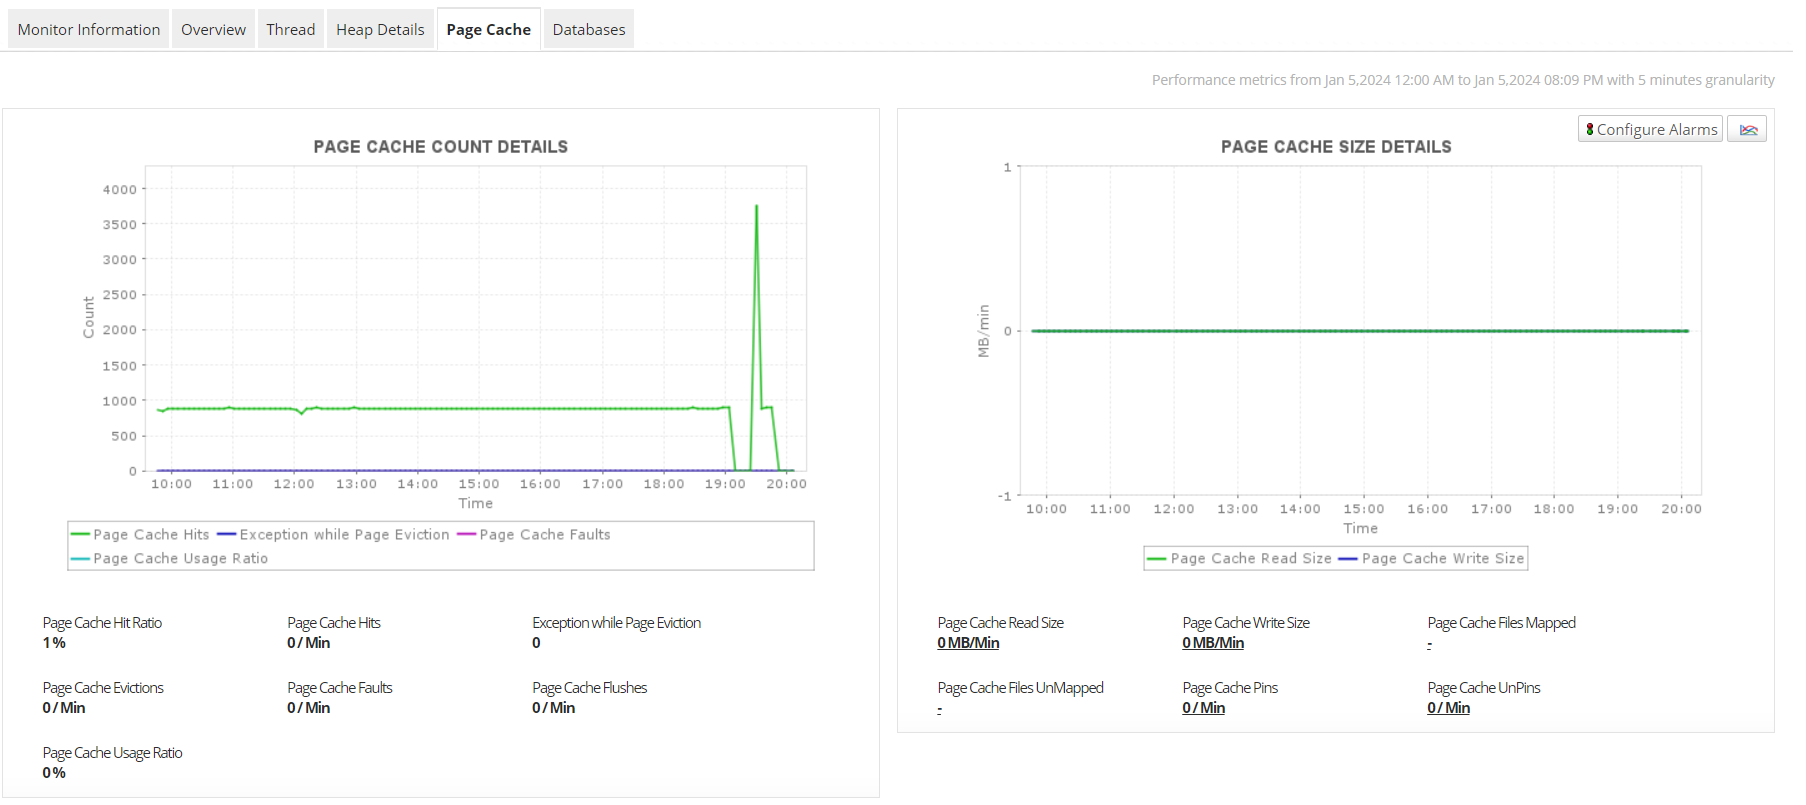
The page cache is used to deposit the Neo4j data as stored on disk. Applications Manager's Neo4j performance monitoring capabilities provide Page Cache Count Details and Page Cache Size Details. Cache metrics such as Hit Ratio, Flushes, Hits, Faults, Evictions, Files Mapped and Unmapped, and others helps visualize the caching process and reveals discrepancies which can be resolved. Ensuring that most of the graph data from disk is cached in memory will help avoid frequent access to disk which takes time.

Identify the root cause of various issues with Root Cause Analyzer and troubleshoot them quickly. Generate notifications based on the applied alerting rules on key metric data and escalate issues through email or SMS. Thresholds can be designated for various container parameters, and alerts can be configured to trigger in the event of a threshold violation.
Setting up anomaly profiles can help you identify gradual performance degradation, so you can take action before end users are affected. You can set baseline limits as a percentage of a fixed baseline value or opt for "Dynamic baselining" where the data will be compared with the previous week.

Analyze the performance trends with trend analysis reports provided by Applications Manager's Neo4j monitor. Trend Analysis report consists of History Report, Hour of Day Report, Day of Week Report, Statistical Report, Heat Chart of key Neo4j parameters. Statistical reports, performance graphs and heat charts help you visualize performance data making it easier to analyze Neo4j server performance periodically. Applications Manager's At a Glance reports are convenient for quick peeks as it gives away a great deal of information, even at a glimpse.
In addition to Neo4j monitoring, Applications Manager also supports monitoring of the following database servers:
Experience the features of Neo4j monitoring on your own by downloading Applications Manager's full-fledged, 30-day free trial!
It allows us to track crucial metrics such as response times, resource utilization, error rates, and transaction performance. The real-time monitoring alerts promptly notify us of any issues or anomalies, enabling us to take immediate action.
Reviewer Role: Research and Development
Trusted by over 6000+ businesses globally