IBM MQ Monitoring
IBM MQ (formerly known as IBM WebSphere MQ), IBM's Message Oriented Middleware (MOM) offering, has a primarily queue based infrastructure.
Applications Manager's
middleware monitoring capabilities allows you to monitor the performance attributes of MQ Objects like channels and queues while also enabling easy alerting, health check and management of your
IBM Integration Bus.
Resolve incidents before they become an issue, enjoy improved service levels and reduced risk of downtime within your IBM MQ infrastructure.
Monitor Queue Manager
-
Discovery entire Queue Manager clusters, monitor every individual queue as well as multiple queue mangers on multiple hosts.
-
Determine queue usage stats, the percentage of the queue free and track the messages causing problems.
-
Find the oldest message age, track excessive queue depths and manage queue traffic.
Monitor Channel Stats
-
Get detailed information about
channels associated with a specific queue manager.
-
Channel-level monitoring provides a graphical representation of various attributes, like the channel traffic (bytes and buffers sent and received).
-
Calculate the message count for the selected queue over time, data flow to and from the transmission channel, transmission speeds and compression rates for various time intervals.
Track Performance of more MQ components
-
Monitor the health of your messaging system by tracking MQ objects like listener processes of four types of listeners: TCP, NetBIOS, SPX, and LU6.2 and session count.
-
Manage and monitor the health of MQ services and create reports on service stats.
-
Manage Your MQ Configuration - Configure, change and compare queues, messages, and more
Event Log
-
Get detailed information about each type of event: queue manager, channel, and performance.
-
Generate event messages when certain events occur.
-
Monitor command and configuration events, which are very useful for generating audit trails.
-
Perform simple event filtering and event search using event name, type and more.
-
Generate PDF reports of events stats over various time intervals.
Reduced complexity in managing your middleware
-
Manage middleware performance and automation across platforms.
-
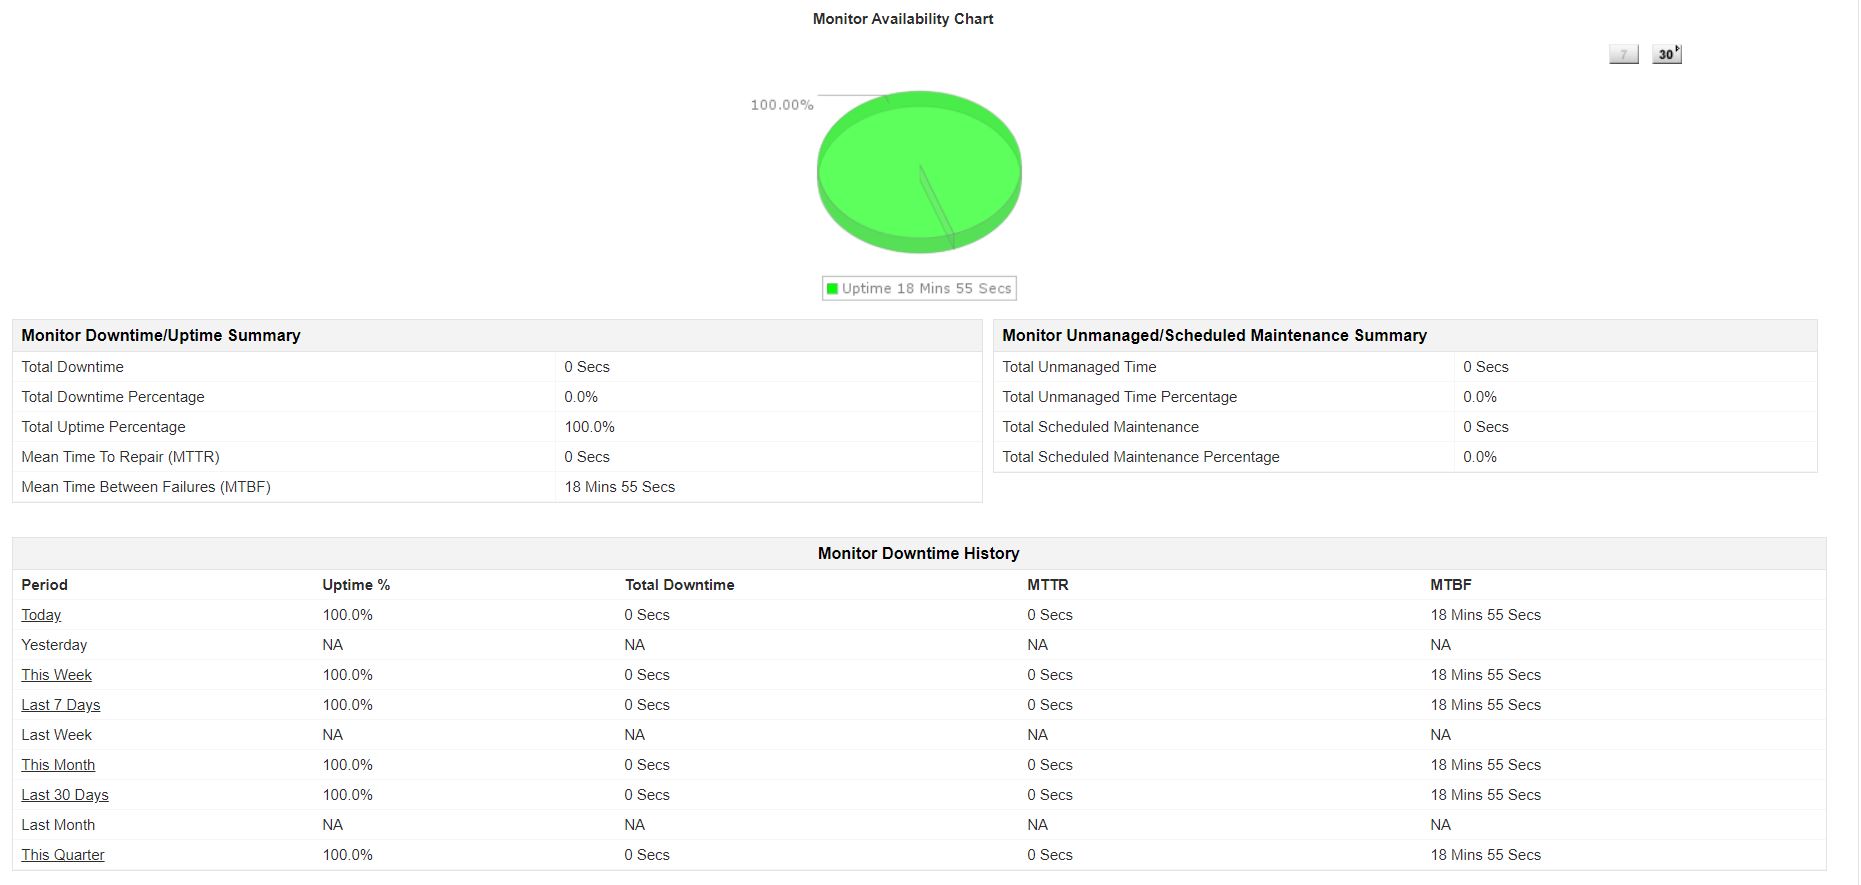
Get instant performance graphs and reports which can be grouped based on availability, health, and connection time.
-
Determine root cause of problems faster and minimize risks associated with performance outages.
-
Configure alarms and get immediate notifications of incidents to get your production running.
-
Analyze trends to ensure that your IBM MQ environment has ample resources.
Related Monitoring


