Monitor the performance of ManageEngine ADManager Plus.
ManageEngine ADManager Plus is an easy-to-use Windows Active Directory Management and Reporting Solution that helps AD Administrators and Help Desk Technicians with their day-to-day activities. With a centralized and Intuitive web-based UI, the software handles a variety of complex tasks like Bulk Management of User accounts and other AD objects, delegates Role-based access to Help Desk Technicians, and generates an exhaustive list of AD Reports, some of which are an essential requirement to satisfy Compliance Audits. This Active Directory tool also offers mobile AD apps that empower you to perform important user management tasks right from your mobile devices.
Applications Manager provides you with critical information (like CPU and memory usage, thread count and PGSQL / MSSQL database details) essential to track the performance of ADManager Plus. Get instant notifications when there are performance issues. Become aware of performance bottlenecks and take quick remedial actions before your end users experience issues.
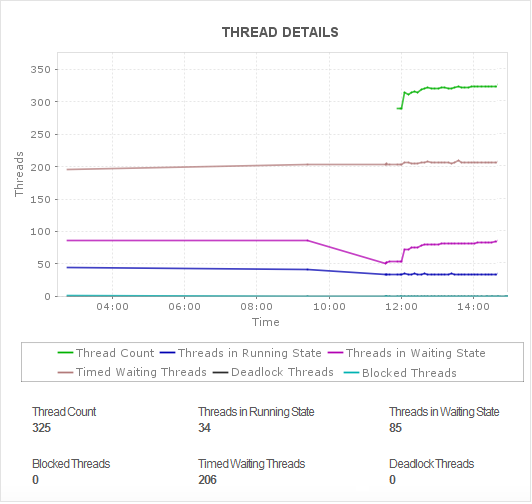
The three key components that can be altered to improve performance are CPU, Memory and Disk. With Applications Manager, you can monitor metrics like CPU and memory usage and thread count; and make decisions on how to scale the application's capacity. Collect critical JVM metric information essential to track the performance of ManageEngine ADManager Plus. Drill down to the root cause of issues, generate granular performance reports and use dial graphs to see the detailed performance statistics.

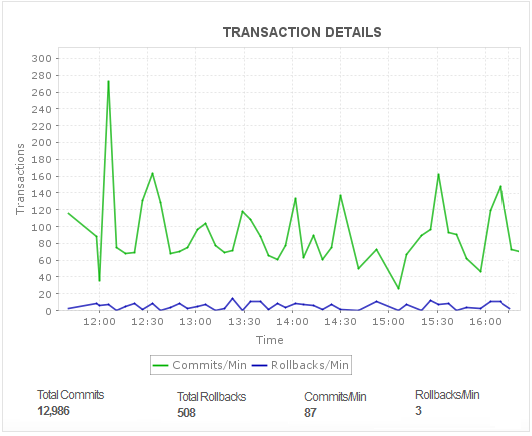
Optimize ADManager’s database backend activity and analyze performance with comprehensive PostgreSQL monitoring capabilities that enable DBAs to proactively monitor their business-critical database servers. Resolve bottlenecks impacting PostgreSQL response times with metrics like CPU, memory and disk utilization data, transaction details and statistics pertaining to buffers, connections, queries and locks.

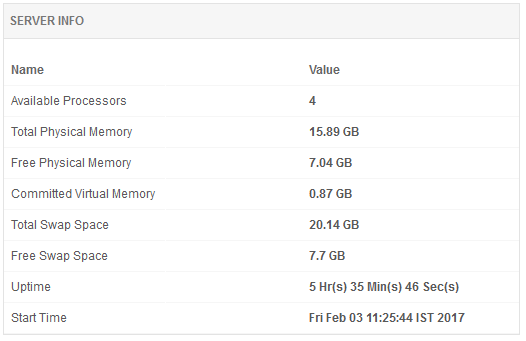
Fine-tune monitoring configuration and narrow down to the root cause of a problem quickly. Monitor processors numbers with detailed utilization reports for each CPU instance. Specify thresholds and be notified when the processor time hits the limit, or when the disk space is being used up more than acceptable levels.

You are presented with a clear picture of performance issues enabling you to effectively tackle application slowdowns. Get instant notifications when there are performance issues. Become aware of performance bottlenecks and take quick remedial actions before your end users experience issues.
It allows us to track crucial metrics such as response times, resource utilization, error rates, and transaction performance. The real-time monitoring alerts promptly notify us of any issues or anomalies, enabling us to take immediate action.
Reviewer Role: Research and Development
Trusted by over 6000+ businesses globally