Ensure your servers and applications are available 24/7 by analyzing their attribute performance trends. ManageEngine Applications Manager's advanced analytics provides complete, accurate, and objective information that's easy to interpret and focuses on historical and predictive analytics. These insights provide vital details that help you make educated decisions. Plus, you'll have the flexibility to customize, schedule, and publish more than 100 detailed reports.
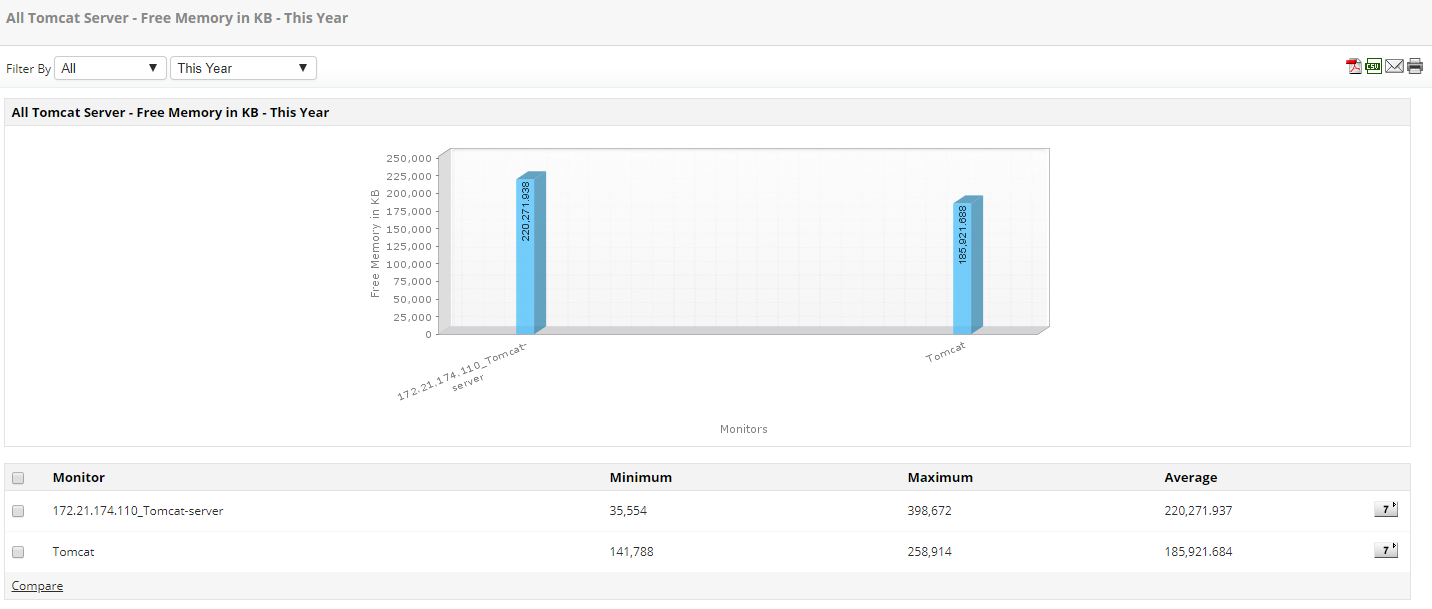
Applications Manager collects application performance data dynamically for periodic analysis and to record data changes. The attribute-wise reports in our analytical report tool offer details into individual attributes of different applications, along with their performance statistics. For example, the response time attribute report for databases enables users to identify slow-performing databases, and analyze their trends. These data-driven insights can help make informed decisions regarding various aspects across different facets of ITOps.
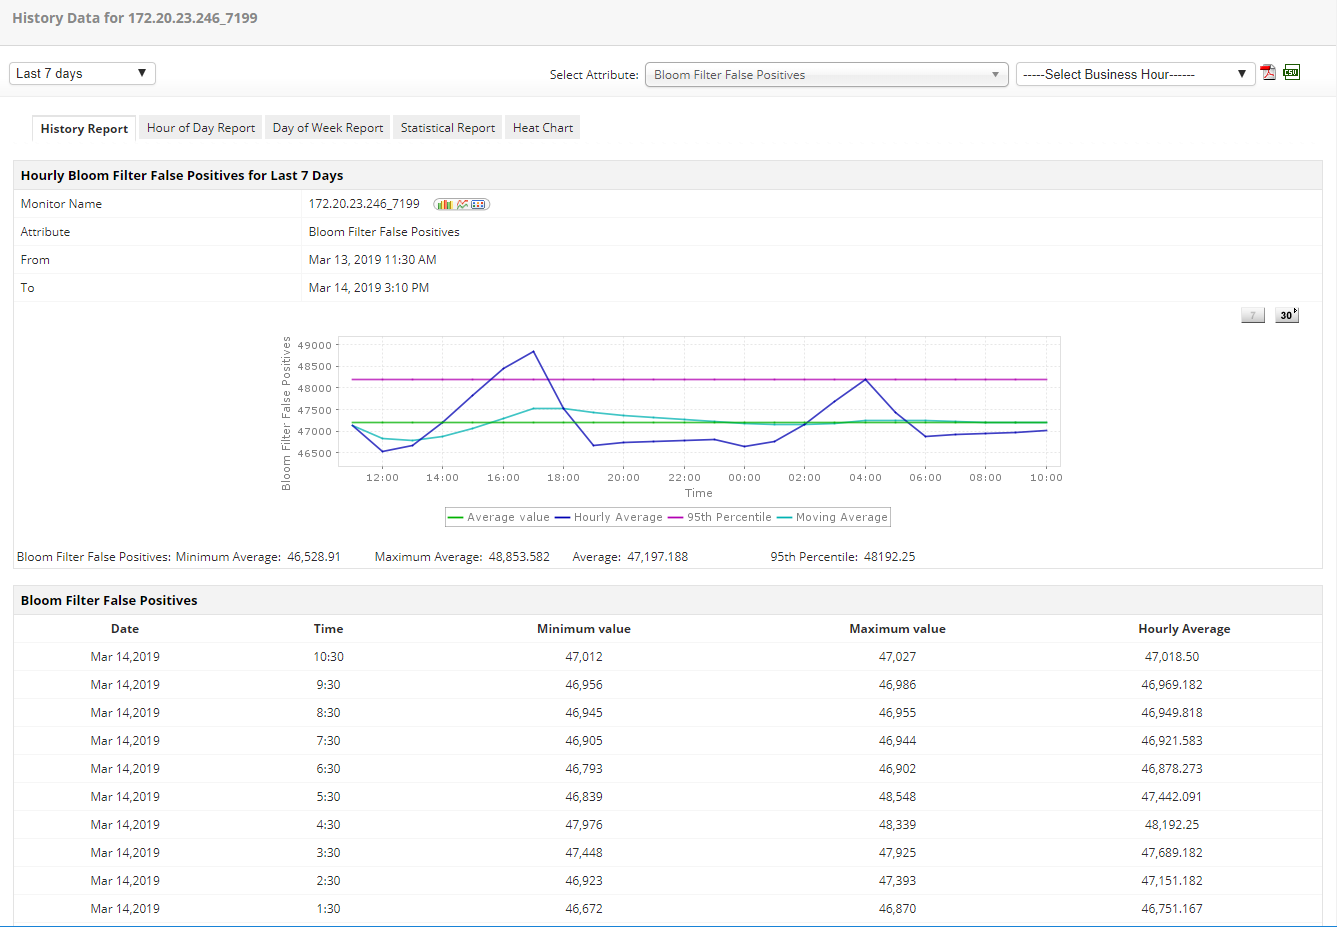
Historical reports present aggregated data on the past performance of various attributes to enable trend analysis. Hourly and weekly performance reports offer insights into everyday performance trends that are complemented by statistical reports and heat charts. With these analytical reports, you can visualize the overall performance to discover patterns of slow performance, so you can address and fix the issue. Statistical reports display a graphical representation of standard deviations of various attributes over a period. These numbers come in handy when analyzing server space allocation. This type of analytical report allows admins to gauge the efficacy of revisions in the development cycle and identify potential oppotunities for growth in performance.
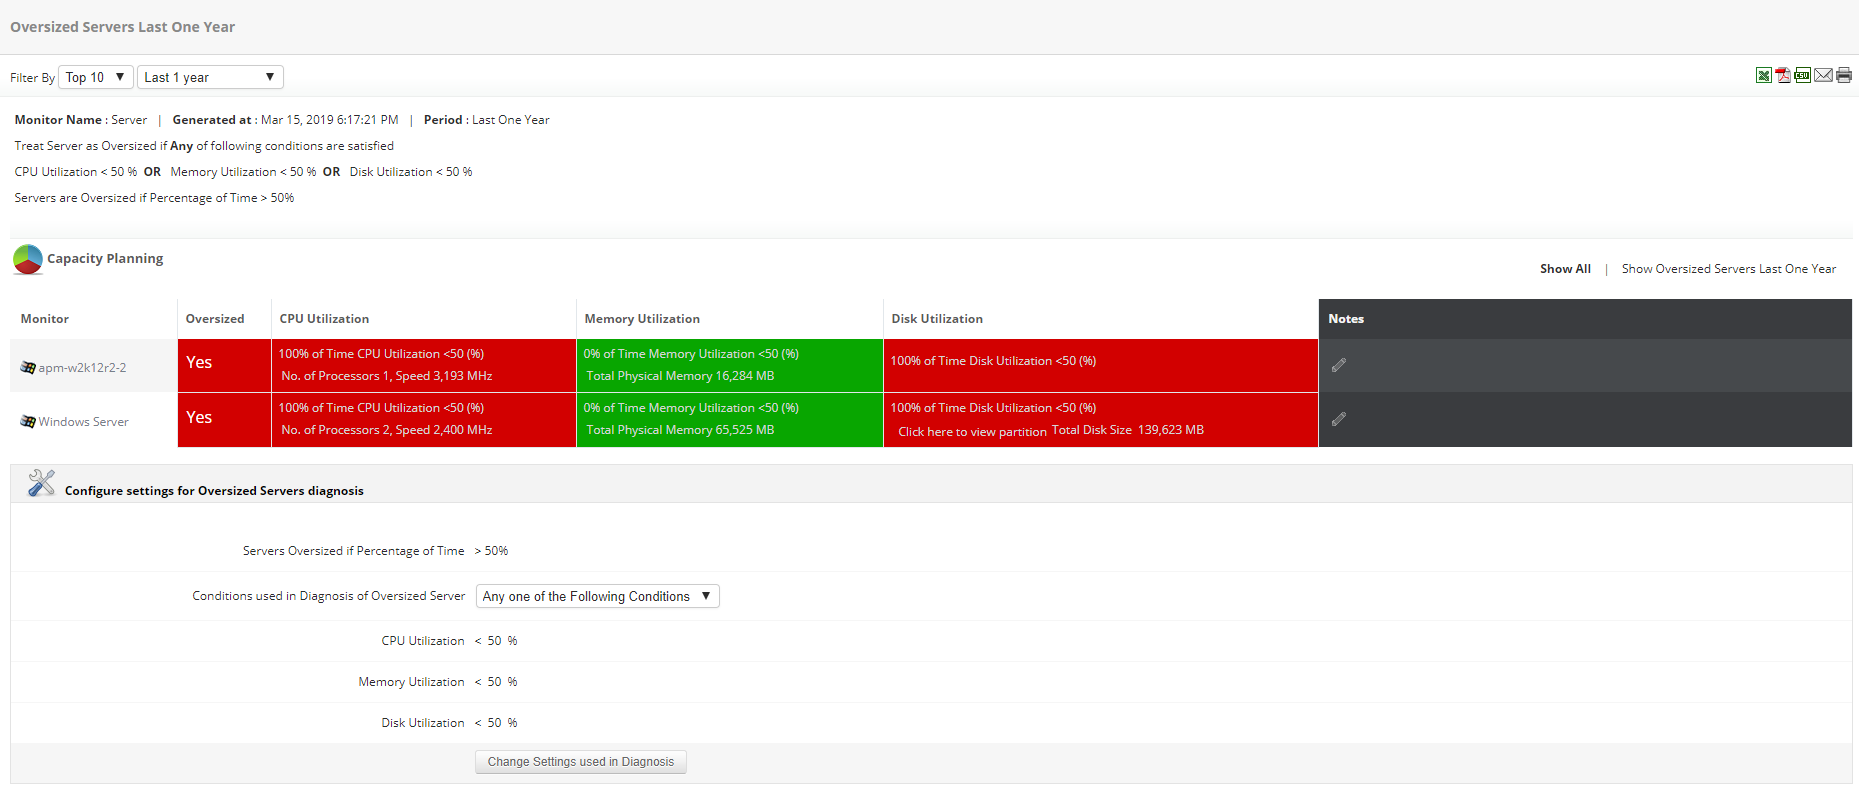
Rightsizing servers is an essential part of IT infrastructure management. Advanced analytics for capacity planning enables you to properly allocate resources in your IT infrastructure to ensure that there is no undersupply or oversupply of resources. With the help of capacity planning reports, you can rightsize your servers by identifying which servers are overused, underused, or have been idle for a considerable amount of time. Effective resource allocation among existing servers reduces hardware costs by a huge margin.
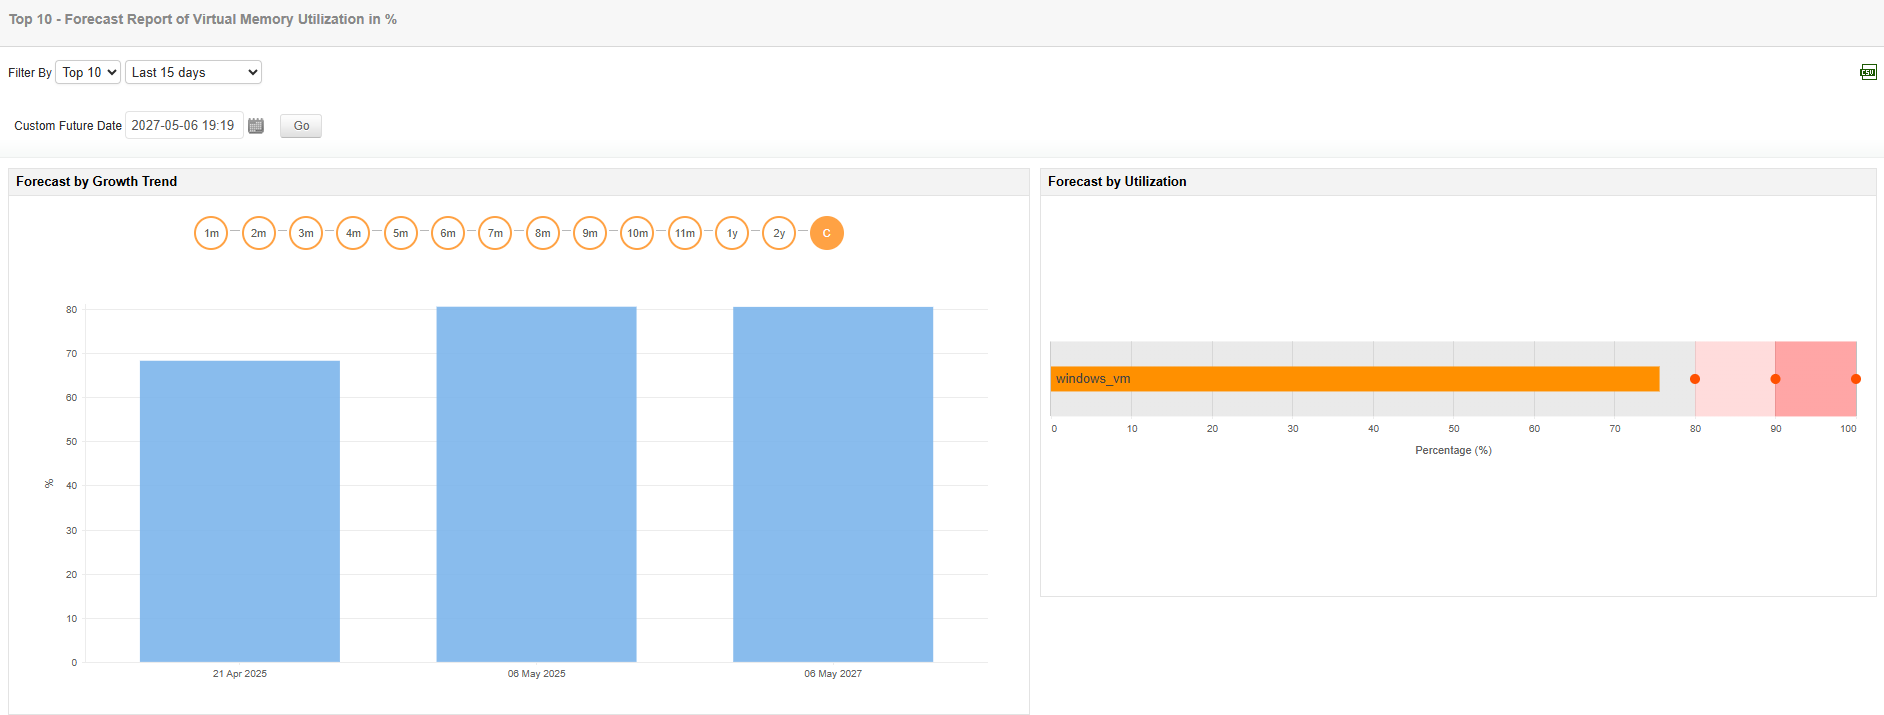
Based on historical performance data, Applications Manager's predictive analytical report offers insight into future growth and utilization trends of various applications in the network. By configuring advanced analytics in your monitoring set up, you can preempt potential resource issues with the help of our ML-enabled forecast reports. You'll also be notified when application utilization or growth stats become a concern, so you can resolve issues quickly and efficiently.
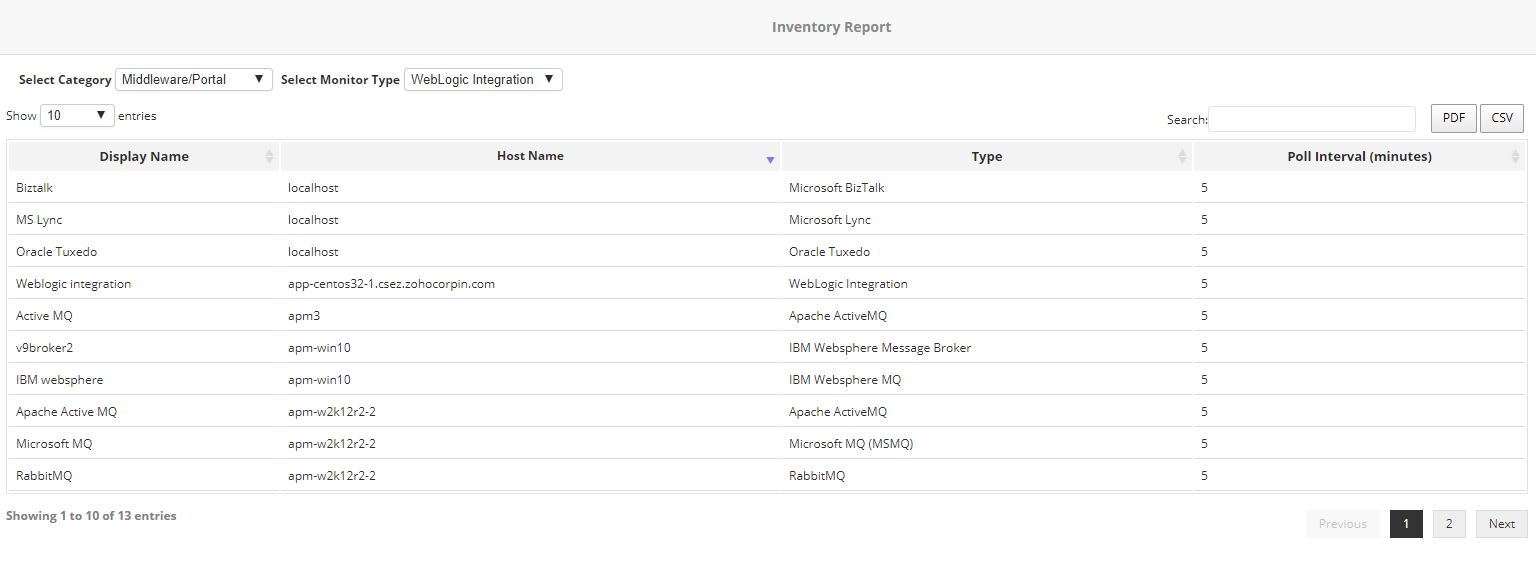
Applications Manager's inventory reports give you an overview of all the servers and applications on your system, similar to how an inventory list works for retailers. You can choose the monitor types and the columns to be included, and export the report in PDF and CSV formats.
Our applications analytics tool enables you to set up your own agenda by choosing the type of reports you want to generate, when you want them to be delivered, how often, and in what format. Configure when you want to collect data, and publish these performance reports on your own internal portals. Download a free trial to start monitoring and generating reports.
Here's what makes Applications Manager stand out of the crowd when it comes to Application Analytics:
It allows us to track crucial metrics such as response times, resource utilization, error rates, and transaction performance. The real-time monitoring alerts promptly notify us of any issues or anomalies, enabling us to take immediate action.
Reviewer Role: Research and Development
Trusted by over 6000+ businesses globally