Istio is a service mesh platform used to interconnect microservices. It's a complex distributed system, visibility into which is clouded without a proper monitoring tool. It is a cluster of various components which run as separate pods in Kubernetes environments. Therefore, to ensure the health and availability of Istio, Kubernetes monitoring is necessary as well. ManageEngine Applications Manager offers monitoring of both Istio service mesh and Kubernetes pods from a single console.
There are five main components in an Istio service mesh:
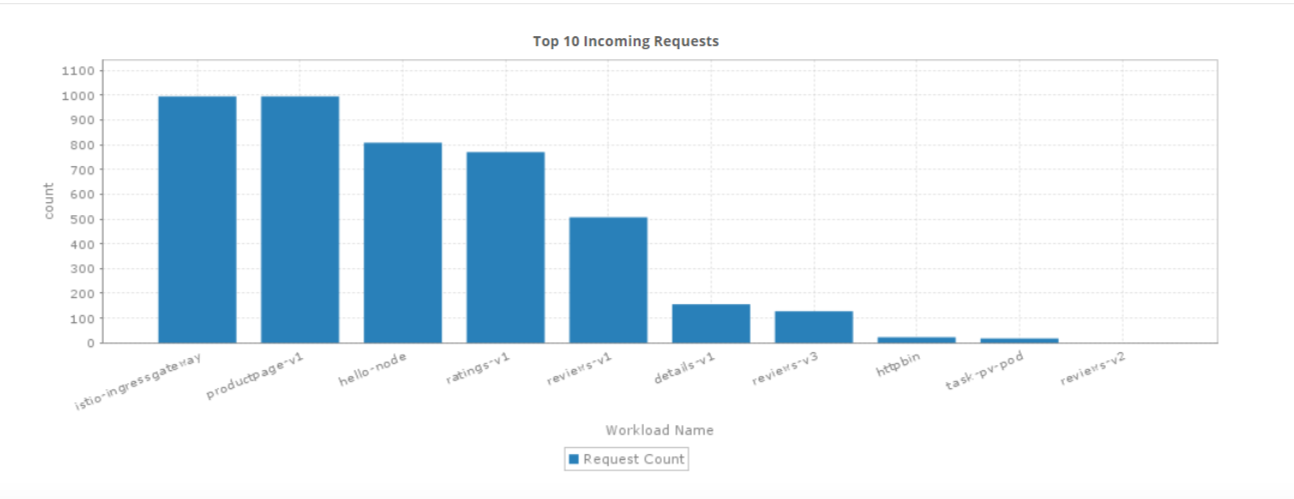
Envoy is a high-performance proxy which mediates all the messages between the services in the service mesh. Envoy is the only Istio component that interacts with the data plane traffic(network messages between the services). The number of requests indicates the overall throughput of requests between services in your mesh, and increases whenever an Envoy sidecar receives an HTTP or gRPC request. Any discrepancy in the inbound and outbound traffic indicates an issue with the "Pilot" component. Monitoring the request size and duration lets you sense performance degradation. High latency is usually caused by system issues like higher CPU utilization, database write latency, higher execution time for new code, and new downstream services within the request path.

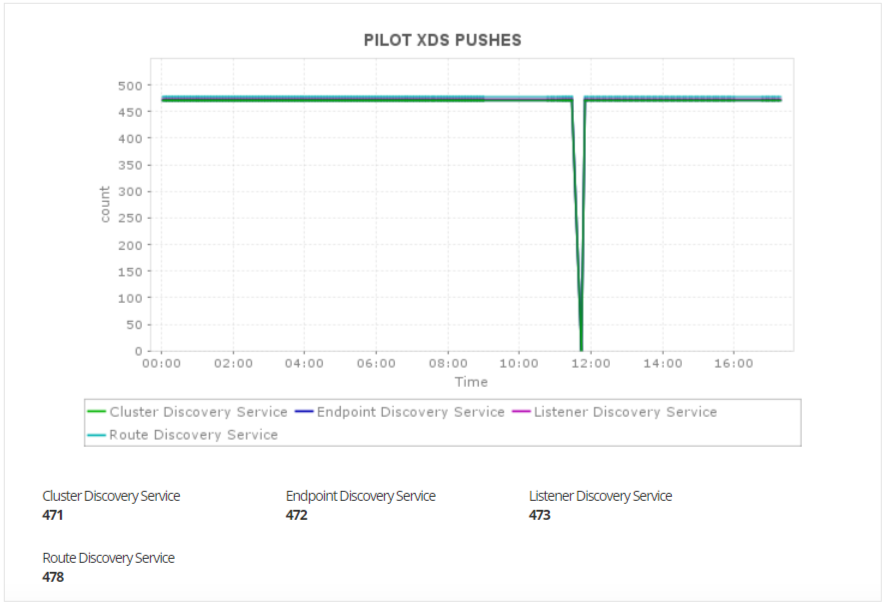
Pilot converts high level routing rules that control traffic behavior into Envoy-specific configurations, and propagates them to the sidecars at runtime. Maintaining metrics like Pilot XDS pushes and Proxy Convergence Delays within the admissible range is crucial to ensure the availability of the Istio service mesh. Applications Manager's Istio monitoring tool provides you comprehensive information about pilot operations with stats like number of Inbound and Outbound Port Conflicts, Unsteady Endpoints, Clusters without instances, number of regular and Virtual Services, and Duplicate Envoy Clusters in addition to Pilot XDS pushes and Proxy Convergence Delay.

Citadel enables strong service-to-service and end-user authentication with built-in identity and credential management. Our Istio service mesh monitoring tool gives you details such as Certificate creation count, Expiry date of certificate, Days remaining until certificate expiration, CSR count, and gRPC response type and count. Monitoring the Citadel will help you ensure that the transactions between the services are secure.

Galley responsible for insulating the rest of the Istio components from the details of obtaining user configuration from the underlying platform like Kubernetes. Monitor key metrics like Galley validations passed, Galley validations failed, Events processed, Successful Event Handles, number of configuration changes processed by a Galley strategy and snapshots published by a galley strategy using Applications Manager's Istio monitoring service to understand the load on the galley server and allocate load accordingly.

Mixer provides a generic intermediation layer between application code and infrastructure backend; this component was deprecated from version 1.5. Applications Manager's Istio monitoring service enables you to monitor metrics like Adapter configurations and errors, Handler configurations and errors, Instance configurations and errors, Rule configurations and errors, and Template configurations and errors.
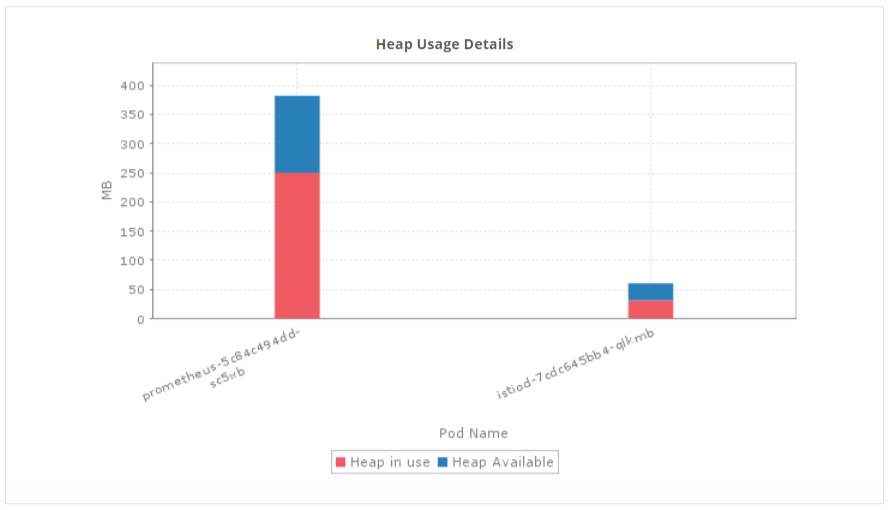
With Applications Manager's Istio monitoring tool, you can monitor the Istio pods using Go language. Go stats like Go memory allocation, Go threads, Go routines, cache usage and heap memory usage are available at your disposal. Keeping these metrics within the acceptable range will ensure that the overhead on the server doesn't affect the pod performance.

Information about the Go processes running in the pods is also available. Monitoring descriptor stats, virtual memory usage, process start time and the total running period can help you identify time and memory intensive processes.

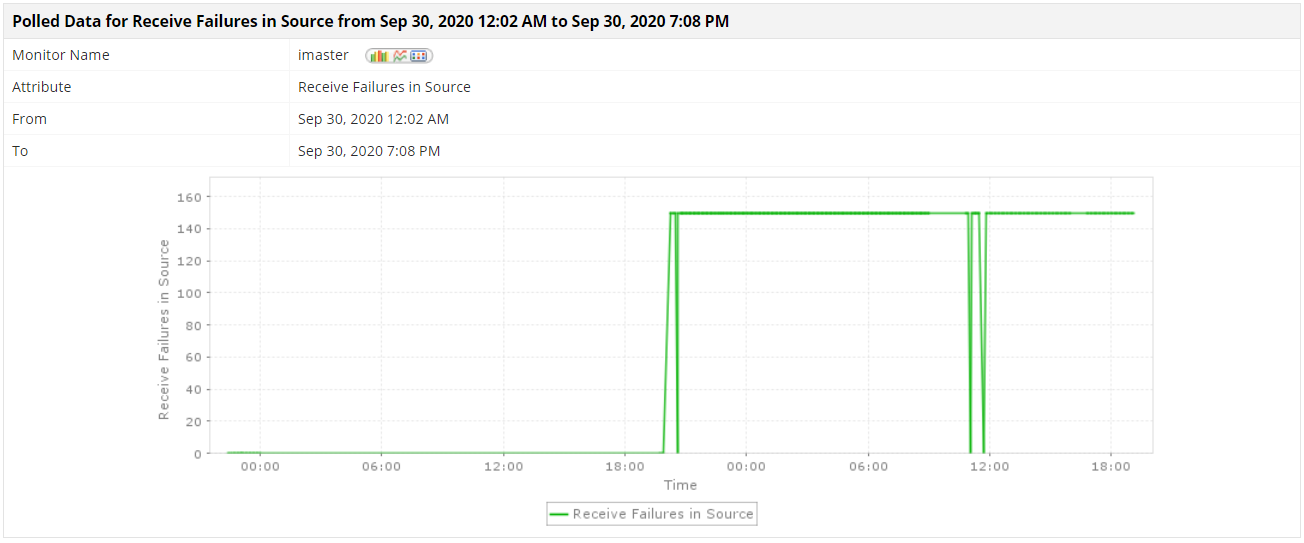
With its powerful fault management system, Applications Manager's Istio monitoring tool procures data on the faults that occur in the system, as well as drilled-down data on the origins of those faults. This speeds up the fault analysis and troubleshooting process considerably. Integrating microservices monitoring into your Istio setup enhances fault detection by providing deep insights into inter-service communication failures. It's easy to configure thresholds for various performance attributes and raise alarms whenever those thresholds are breached. You can choose to receive alerts through email, SMS, messages in Slack channels or as tickets in ServiceNow or ServiceDesk Plus.
Set up anomaly profiles with dynamic baselines to investigate gradual performance degradation which might otherwise go unnoticed. You can also trigger automatic actions, such as email/SMS escalation, Windows service action, and MBean operation, with thresholds and anomaly profiles to be performed upon violation.

Applications Manager's Istio monitoring tool provides extensive reports on all important performance attributes for analyzing the historical trends. Forecast reports offered by Applications Manager enables you to predict growth and utilization trends using machine learning techniques, which helps you during capacity planning.

To experience Applications Manager firsthand, download our 30-day free trial or schedule a personalized demo for a guided tour.
It allows us to track crucial metrics such as response times, resource utilization, error rates, and transaction performance. The real-time monitoring alerts promptly notify us of any issues or anomalies, enabling us to take immediate action.
Reviewer Role: Research and Development
Trusted by over 6000+ businesses globally