Get deep insight into the health and performance of your SAP HANA implementations and perform rapid troubleshooting of issues before users are affected using Applications Manager's SAP HANA monitoring. The best way to be capable of analyzing every micro-element within your database system is to ensure that you have a reliable tool that covers everything mentioned in our SAP HANA monitoring checklist.
Monitor the availability status of the SAP HANA database as well as the most important system metrics such as the CPU usage, memory consumption and disk utilization. Know how much memory is used by the host, how much memory is used by column tables, row tables, code and stack, and database resident. Our SAP HANA monitor notifies you when any of these resources are overutilized that allows you to free up these resources or add additional capacity.
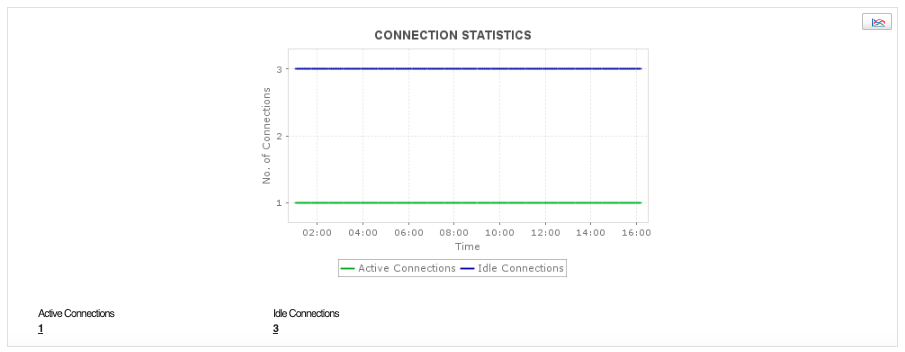
User connections to the SAP HANA server are a good indicator of the load on the database server. Applications Manager's SAP HANA performance monitoring capability furnishes you with information on the number of connections are currently active/running and how many connections are idle. If a user complain about the sluggish performance of the database, you may want to check the existing connections and terminate idle connections, if necessary, to reduce the load on the server.

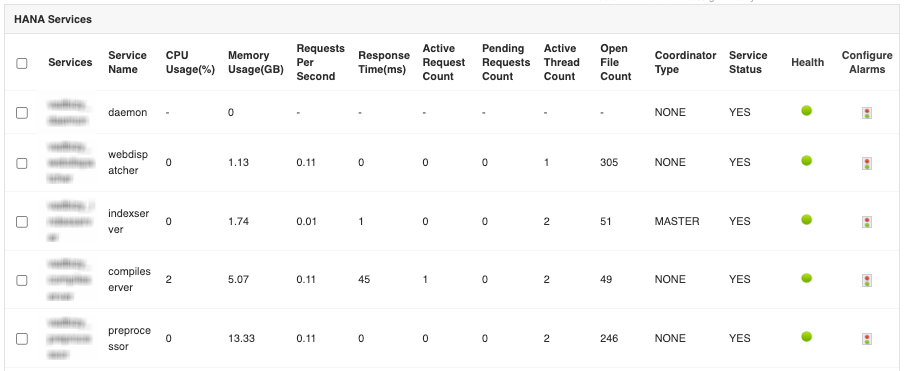
Check if the critical services of the SAP HANA database are currently active and how quickly they are processing requests. Find out the CPU and memory used by each service, the requests currently pending for processing with each service, and the number of active threads with our SAP HANA system monitoring.

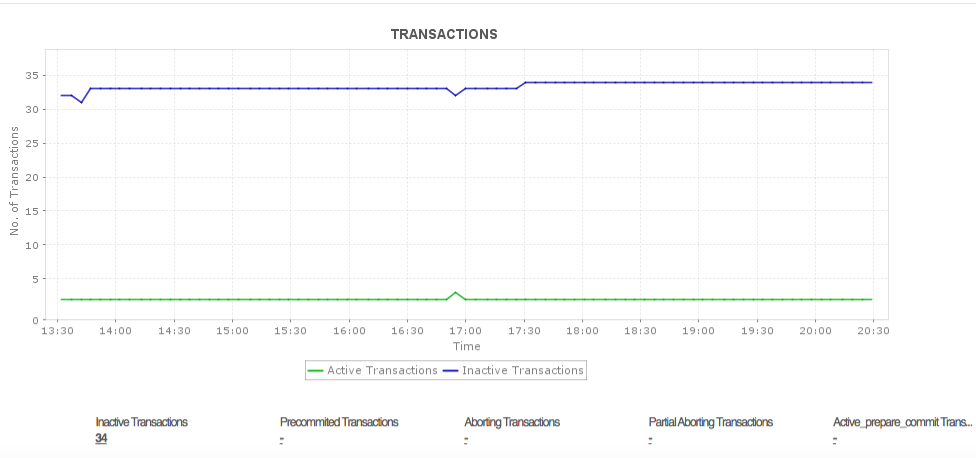
Find out details of transactions executed in the SAP HANA database such as active and inactive transactions, aborting transactions, etc. Know if any transactions are getting blocked. Identify trends and troubleshoot issues by looking at SAP HANA system alerts for specific time periods. Find out if the server utilizing its cache well or if you should resize the cache to ensure its effective usage.

Understand how the HANA server is handling its workload. Track the type of statements being submitted to the server for execution such as commits and rollbacks, as well as the current execution and compilation rates and memory usage of each service. Employing the aid of SAP HANA database monitoring is one of the best ways to isolate the services facing heavy load and identify the query types that are responsible for such high load.
Expensive statements are SQL queries whose execution time exceeded a configured threshold. Use Applications Manager to check if there are any expensive SQL statements executing on the SAP HANA database server and the maximum duration of its execution.

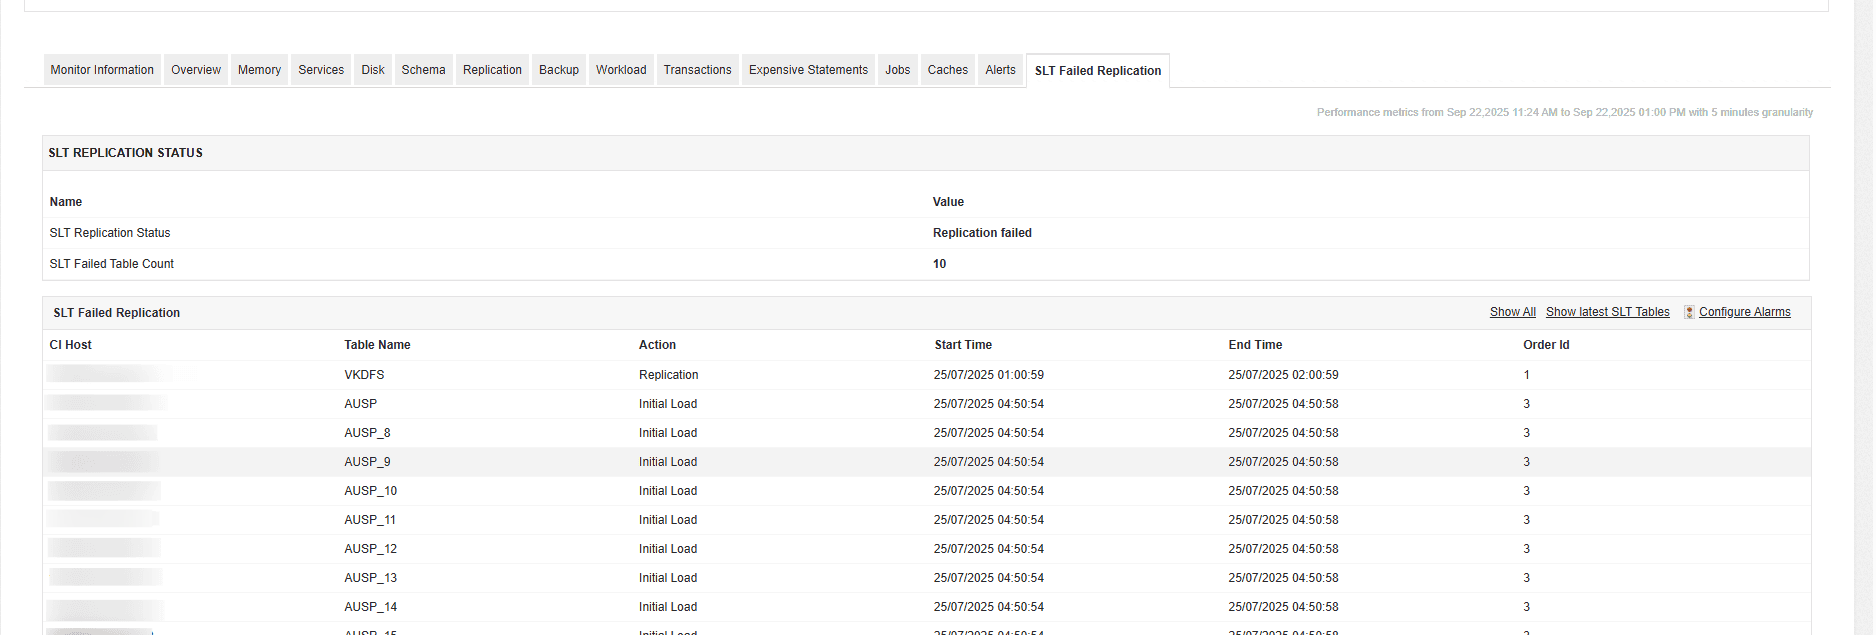
Applications Manager’s SAP HANA monitoring now extends support for monitoring SLT Replication to help you track the replication status and identify tables that failed to replicate. This ensures data consistency between the source and target systems and enables administrators to quickly detect and troubleshoot replication issues.
The SLT Replication Status metric provides an overview of the current replication health. It indicates whether replication has completed successfully (No replication failures) or if any errors have occurred (Replication failed). Alongside this, the SLT Failed Table Count metric displays the total number of tables that encountered replication failures during the latest status check.

In scenarios where replication fails, Applications Manager also provides detailed information on the affected tables. You can view the host on which replication is running, the table name, and the action currently being performed — such as Initial load, Autocorrection phase, Finished autocorrection phase, Still in catch-up phase (HANA DB only), or Replication. Each entry also includes the start time and end time of the action, along with the order ID, which serves as a unique identifier for the replication order.
Get instant notifications when there are performance issues with the SAP HANA database. Analyzing the performance data generated through Applications Manager makes it easier to manage your SAP HANA system and take corrective actions quickly before end-users are affected.
As part of Applications Manager's SAP Monitoring capabilities, you can start monitoring your HANA RDBMS system in just a few steps. It is easy to setup, navigate, and control. Explore all the features that our SAP HANA monitoring software has to offer. Download a FREE 30-day trial now!
It allows us to track crucial metrics such as response times, resource utilization, error rates, and transaction performance. The real-time monitoring alerts promptly notify us of any issues or anomalies, enabling us to take immediate action.
Reviewer Role: Research and Development
Trusted by over 6000+ businesses globally