Applications Manager's Oracle Coherence monitoring utility helps you get deep insight into the health and performance of complex Coherence implementations in production and perform rapid troubleshooting of issues before users are affected.
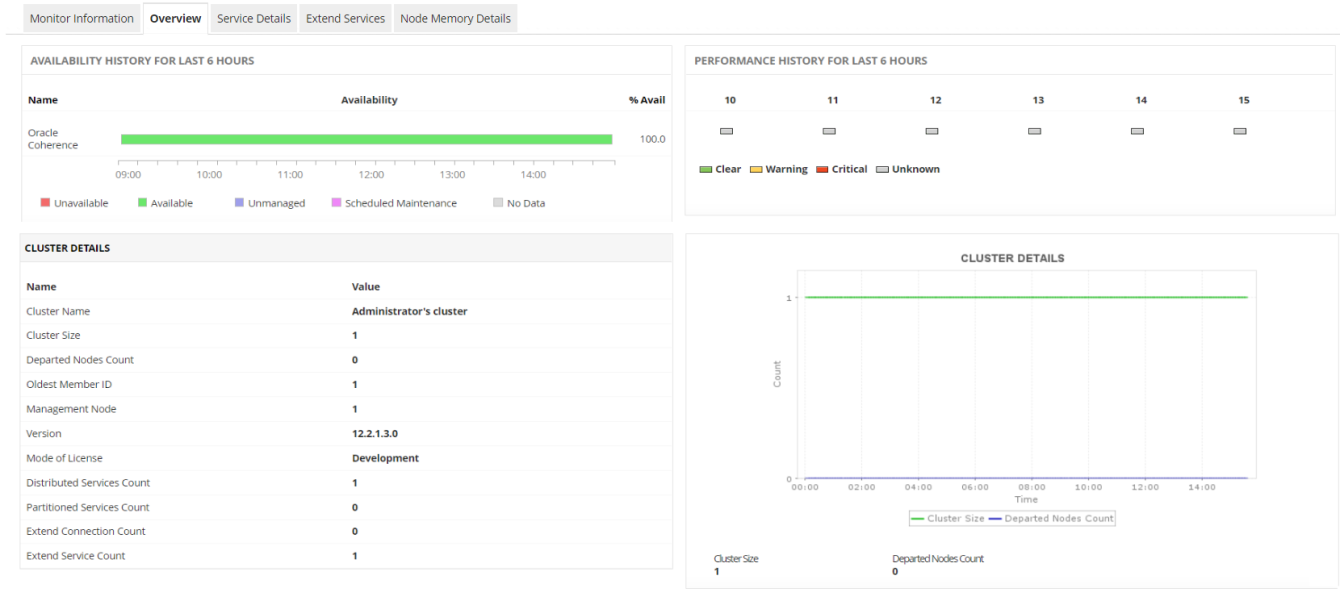
Typically, Oracle Coherence clusters have large number of nodes and distributed caches. IT administrators find it tough to ensure availability and performance of Oracle Coherence clusters. With Applications Manager's Oracle Coherence monitoring tool, you can quickly know the overall health and performance of your Coherence clusters and identify potential problems. Track key metrics such as cluster size, departed nodes, number of distributed and partitioned services, and number of extend connections and extend services.
Track the health of distributed and replicated cache services in the Coherence cluster. See the individual services that are running, which ones are storage enabled and which ones are not, some partition information such as Endangered and Vulnerable partitions, and the message sent/received rates. Monitor Oracle Coherence to find out the 'high availability' status of the services (Endangered, Node-safe, Machine-safe) and understand which cluster members can be stopped without data loss. You can easily enable, disable or delete services and compare metrics across different services.

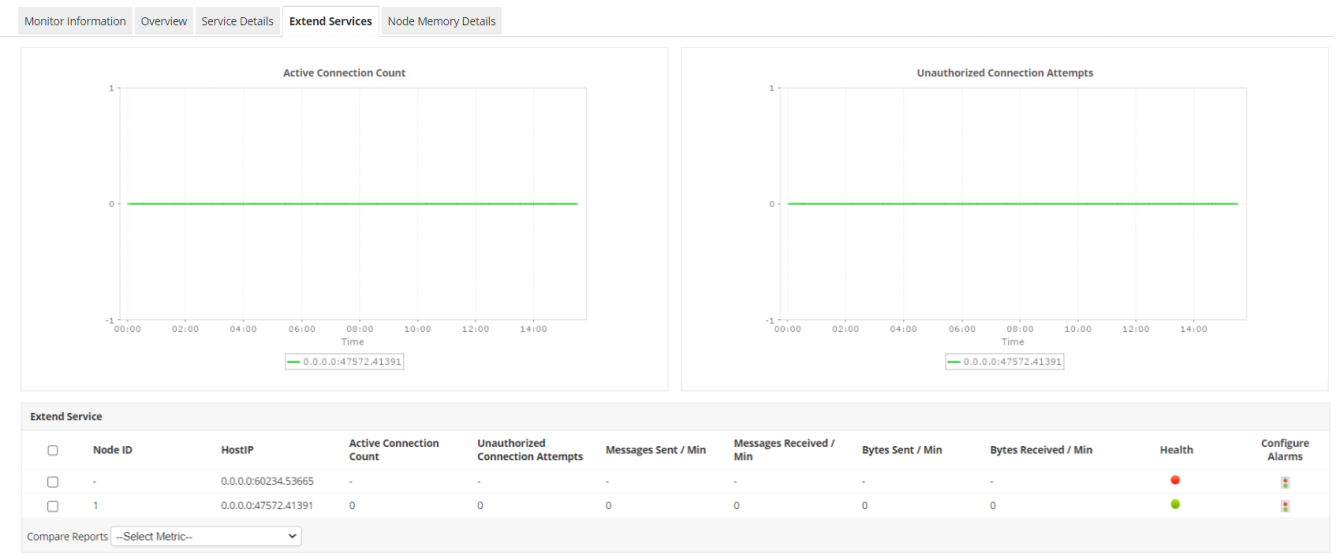
Monitoring Oracle Coherence can help keep track of unauthorized connection attempts, active connection counts, and messages sent/received per minute for each extend service. You can also view some information about Extend connections such as Messages received/sent, the remote address of the node, etc.

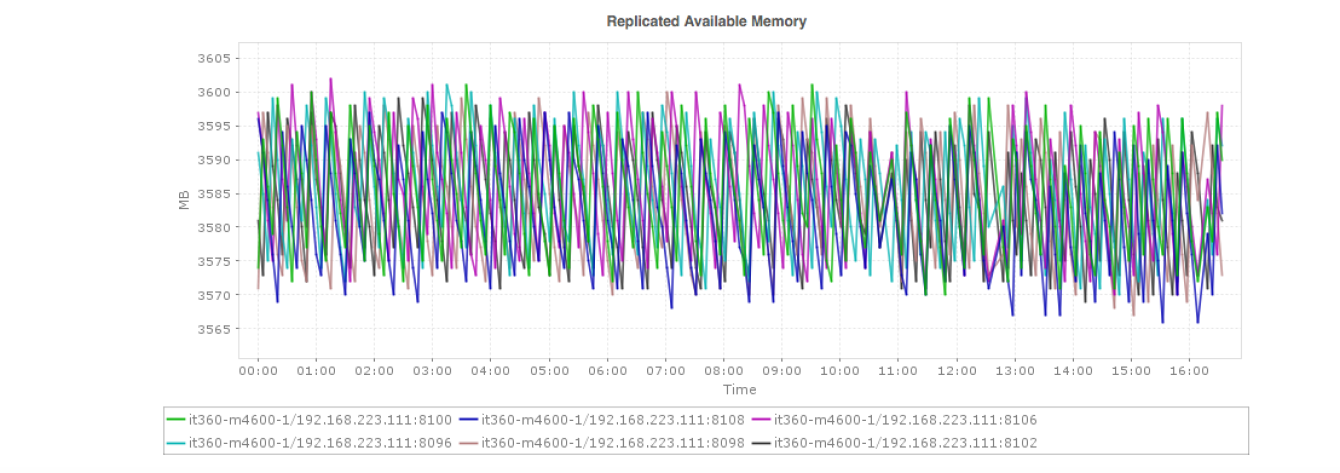
Track cluster memory details including the memory of all distributed and replicated nodes within the cluster. Ensure data publishing is at the correct level and that the packet publisher/receiver success rates are high. Avoid out-of-memory errors at all costs. The Oracle Coherence monitor also notifies of low available memory that can help optimize the memory size.

Get instant alerts when there are problems with the performance of Coherence clusters such as those caused by user and data loads. Become aware of latency, bottlenecks, and timeouts. Find out which app is causing excessive load. Take corrective actions quickly before end users are affected.

Download a 30-day free trial of Applications Manager to experience the Oracle Coherence monitoring feature first-hand! You can also use Applications Manager's Oracle monitoring tool to track the performance of your Oracle database!
It allows us to track crucial metrics such as response times, resource utilization, error rates, and transaction performance. The real-time monitoring alerts promptly notify us of any issues or anomalies, enabling us to take immediate action.
Reviewer Role: Research and Development
Trusted by over 6000+ businesses globally