Apache Spark is an open source big data processing framework built for speed, with built-in modules for streaming, SQL, machine learning and graph processing. Apache Spark has an advanced DAG execution engine that supports acyclic data flow and in-memory computing. Spark runs on Hadoop, Mesos, standalone, or in the cloud. It can access diverse data sources including HDFS, Cassandra, HBase, and S3.
There are many components coming together to make a spark application work. If you're planning to deploy Spark in your production environment, Applications Manager can make sure you can monitor the different components, understand performance parameters, get alerted when things go wrong and know how to troubleshoot issues.
Automatically discover the entire service topology of your data pipeline and applications. Perform in real-time, full cluster and node management, and monitoring of Spark application execution with workflow visualization. Visualize, in the standalone mode, the master and the workers running on individual nodes and executor processes, for every application that is created in the cluster. Get up-to-the-second insight into cluster runtime metrics, individual nodes and configurations.

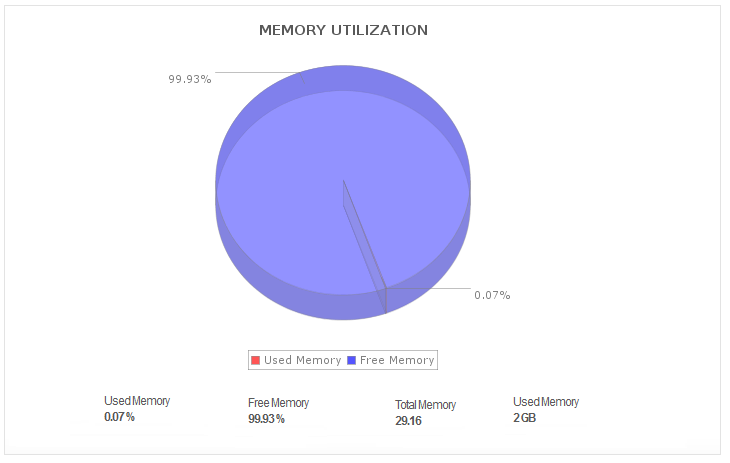
Leverage proactive Apache monitoring techniques to manage resources so that your Spark applications run optimally. When adding new jobs, operations teams must balance available resources with business priorities. Stay on top of your cluster health with fine-grained statistics of performance like from Disk I/O to Memory usage metrics; and node health (in real-time) with CPU usage for all the nodes, followed by JVM heap occupancy.

Gain insights into your Spark production application metrics; organize and segment your Spark applications based on user defined data; and sort through applications based on state (active, waiting, completed) and run duration. When a job fails, the cause is typically a lack of cores. Spark node/worker monitoring provides metrics including the number of free and uses cores so users can perform resource allocation based on cores.

Get performance metrics including stored RDDs (Resilient Distributed Datasets) for the given application, storage status and memory usage of a given RDD, and all the Spark counters for each of your Spark executions. Get deep insights into file level cache hits and parallel listing jobs for potential performance optimizations.

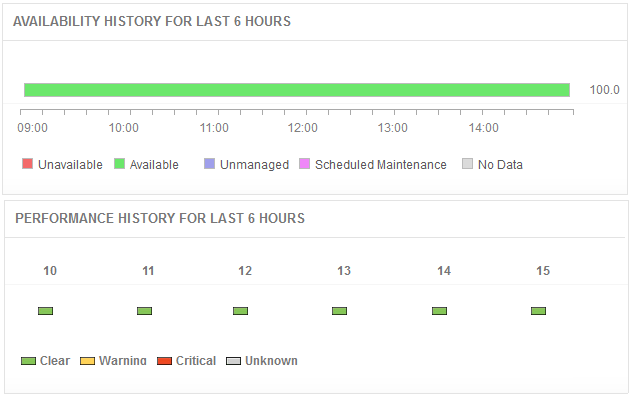
Get instant notifications when there are performance issues with the components of Apache Spark components. Become aware of performance bottlenecks and find out which application is causing the excessive load. Take quick remedial actions before your end users experience issues.
It allows us to track crucial metrics such as response times, resource utilization, error rates, and transaction performance. The real-time monitoring alerts promptly notify us of any issues or anomalies, enabling us to take immediate action.
Reviewer Role: Research and Development
Trusted by over 6000+ businesses globally